Capacity factor
Ratio of actual to maximum possible electrical output.

Centre for Renewable and Sustainable Energy Studies · CC BY-SA 4.0
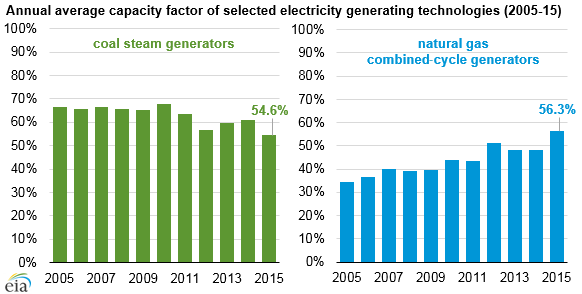
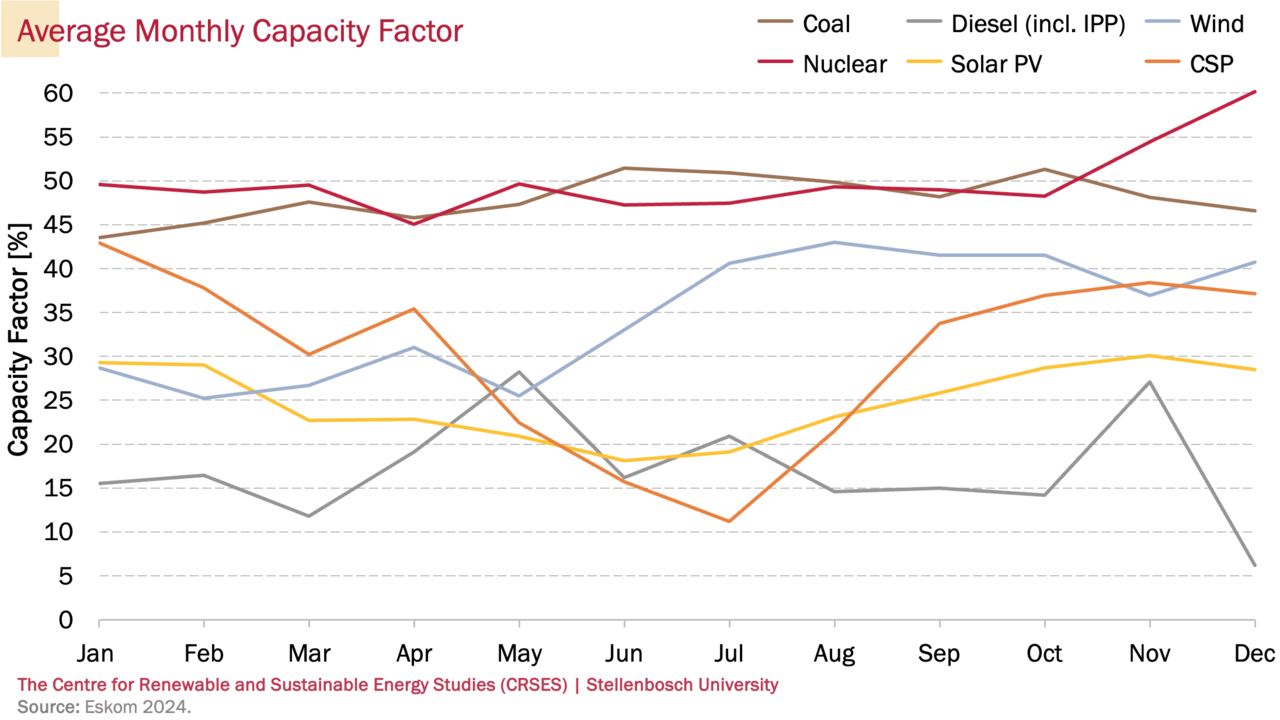
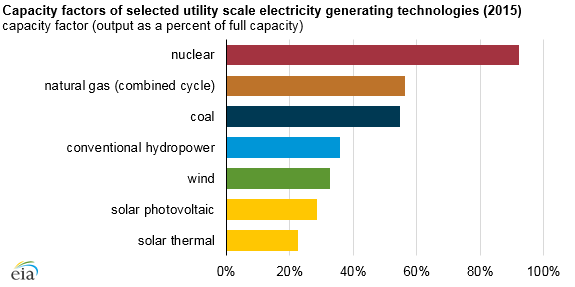
Capacity factor is a unitless ratio that compares the actual electrical energy output of a power plant over a specific period to the theoretical maximum output if it ran continuously at full nameplate capacity during that same period. This metric applies to any electricity-producing installation, whether it relies on fuel combustion or renewable sources like wind, solar, or hydroelectric power, and it serves as a tool for comparing different types of electricity generation. The actual energy output and resulting capacity factor are influenced by numerous factors, including the installation’s design, location, and the type of production. For fuel-based plants, fuel availability matters; for renewables, local weather conditions are key. The capacity factor can never exceed the availability factor, which represents the uptime during the period, as downtime can result from reliability issues, scheduled or unscheduled maintenance, or refueling. Additionally, regulatory constraints and market forces affecting fuel purchase or electricity sale can impact the factor. The capacity factor is often calculated over a year to smooth out temporal fluctuations, but it can also be computed monthly to reveal seasonal patterns, or over the entire lifetime of a power source, including after decommissioning. It can be expressed in full load hours. For example, nuclear power plants typically achieve high capacity factors, limited mainly by maintenance and refueling; one U.S. nuclear unit even reached 104.4% in 2019. Wind farms vary widely, with some onshore sites exceeding 60% capacity factor, while offshore and other onshore farms may be lower, and seasonal demand can influence feasibility. Hydroelectric dams show significant variation based on water availability, as seen in the Hoover Dam’s annual generation ranging from a high of over 10 terawatt-hours to a low of under 3 terawatt-hours. Photovoltaic power stations have an inherent limit due to their reliance on daylight and clear skies, with capacity factors typically computed annually and influenced by latitude, cloud cover, dust, and ambient temperature.
- Definition
- Ratio of actual electrical energy output to theoretical maximum output over a period
- Formula
- CF = E_t / (P_n × t)
- Typical timescale
- Often computed over a year, but also monthly or over lifetime
- Key limiting factor
- Cannot exceed availability factor (uptime)
- Influencing factors
- Reliability, maintenance, design, location, fuel type, weather, regulatory constraints, market forces
Lore & Background
The net capacity factor is a dimensionless ratio comparing a power installation’s actual electrical output over a given period to the theoretical maximum output if it ran continuously at full nameplate capacity during that same time. This metric applies to any electricity-producing facility, whether fueled by coal, gas, or nuclear energy, or reliant on renewable sources such as wind, solar, or hydro. The capacity factor can never exceed the availability factor—the percentage of time the plant is actually operational—since downtime from scheduled or unscheduled maintenance, refueling, or reliability issues directly reduces output. Other influences include the installation’s design, location, and the type of generation; for renewable systems, local weather conditions like sunlight, cloud cover, or wind patterns are critical, while fuel-based plants are affected by fuel supply and market forces. The factor is most often calculated annually to smooth out short-term fluctuations, but monthly calculations reveal seasonal patterns, and lifetime calculations account for both operational and decommissioned periods. Nuclear plants typically achieve high capacity factors, limited mainly by maintenance and refueling outages; for instance, one U.S. nuclear unit reached 104.4% in 2019. Wind farm capacity factors vary widely: offshore sites like Horns Rev 2 have recorded 47.7%, while some onshore farms, such as the Eolo plant in Nicaragua, have reached 60.2%, and annual U.S. averages from 2013 to 2016 ranged from 32.2% to 34.7%. Notably, a wind turbine’s capacity factor is unrelated to Betz’s coefficient, which limits energy extraction from the wind. Hydroelectric dams also show variation; the Three Gorges Dam, the world’s largest by installed capacity at 22,500 MW, had a 2015 capacity factor of about 44%, while Hoover Dam’s average annual generation yields roughly 23%. Photovoltaic solar stations have inherently low capacity factors due to their dependence on daylight and clear skies, with output further affected by latitude, local cloud cover, dust, and ambient temperature.
Reader's Guide
Capacity factor is a crucial metric for evaluating the efficiency and economic viability of power plants. It reflects not only technical performance but also operational constraints such as maintenance schedules, fuel availability, and weather conditions. For nuclear plants, high capacity factors indicate reliable baseload power, while for renewables, lower factors often result from intermittent resources. The metric allows comparison across different technologies, though it must be interpreted with context—for instance, wind turbines can have high capacity factors in favorable locations, and seasonal variations can be significant, as in Finland where winter capacity factors are more than double those in July. Capacity factor is distinct from Betz's coefficient, which limits wind turbine efficiency relative to wind energy. Understanding capacity factor helps in planning energy grids, assessing investment risks, and optimizing power generation.
Did You Know?
- The capacity factor can never exceed the availability factor (uptime) during the period.
Definition and Mathematical Foundation
The capacity factor is essentially a dimensionless ratio that measures how much electrical energy a generating installation actually delivers compared to what it could theoretically deliver if it ran at full rated power without interruption. The theoretical ceiling is established by the nameplate capacity—the installed or rated power of the system—multiplied by the elapsed time. In practice, the calculation is straightforward: divide the total energy produced (expressed in kilowatt-hours, megawatt-hours, or megajoules) by the product of nameplate power and the time window. When consistent units are used, the dimensions cancel, yielding a pure number. For instance, a one-megawatt plant generating half a megawatt-hour in a single hour produces a capacity factor of 0.5, or 50 percent. This ratio can be applied to any electricity-producing facility, whether it burns fuel or harnesses wind, sunlight, or flowing water, and it can also be averaged across an entire class of installations to enable cross-technology comparisons. The metric can additionally be converted into full load hours, offering an intuitive sense of how many hours at maximum output would be needed to match the actual production.
Influencing Variables and Practical Constraints
The capacity factor of any given installation is shaped by a complex web of operational, geographic, and economic variables. At the most fundamental level, it can never surpass the availability factor—the fraction of time the plant is actually online. Downtime from scheduled maintenance, unscheduled reliability failures, or refueling outages all shave directly into the achievable ratio. Beyond uptime, the physical design of the installation, its geographic siting, and the specific generation technology all play a role. For fuel-based plants, the characteristics and cost of the fuel matter; for renewables, local weather patterns become the dominant variable. Regulatory frameworks and market dynamics add another layer of complexity, potentially constraining both fuel procurement and electricity sales, thereby influencing how much of the theoretical output is actually realized. These interacting factors mean that two identical machines in different locations or under different market conditions can produce markedly different capacity factors over the same period.
Nuclear Power: Pushing the Upper Bound
Nuclear generating stations occupy the high end of the capacity factor spectrum because their output is limited primarily by availability rather than by variable fuel supply or weather. The Palo Verde Nuclear Generating Station in the United States, the country's largest nuclear facility, illustrates this clearly. Each reactor undergoes refueling roughly every eighteen months, with one outage occurring each spring and one each fall. nuclear unit that year, demonstrating that under favorable conditions actual output can briefly exceed the nameplate rating.
Renewable Applications and Temporal Flexibility
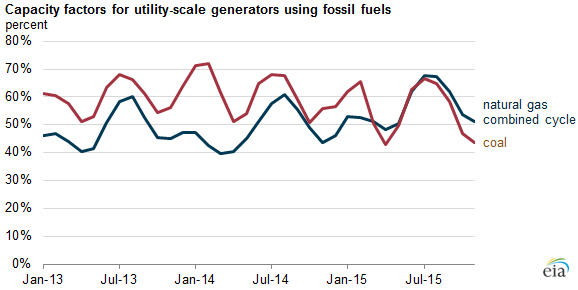
The capacity factor proves equally valuable when applied to renewable installations, where it captures the inherent variability of natural energy sources. Unlike nuclear or thermal plants, wind and solar installations are governed by local weather conditions rather than fuel availability, making their capacity factors inherently lower and more variable. The metric's flexibility extends to the timescale of measurement. While a yearly average smooths out most short-term fluctuations, computing the factor over a single month reveals seasonal patterns. It can also be calculated across the entire operational lifetime of a source, or even after decommissioning, providing a long-term performance picture. This temporal adaptability makes the capacity factor a versatile tool for comparing technologies and planning energy portfolios.
Gallery
Frequently Asked Questions
What is Capacity factor?
It is a unitless ratio that compares the electricity a plant actually delivered over a chosen period against what it would have produced running nonstop at its full rated power. Think of it as a single number capturing how well a facility converts its nameplate potential into real energy.
How do you calculate Capacity factor?
Divide the total energy generated during the measurement window by the product of the plant's nameplate power rating and the length of that window, expressed as CF = E_t / (P_n × t). The result is conventionally reported as a percentage, and the window can be a month, a year, or the plant's entire operating life.
What keeps a plant's Capacity factor below 100 %?
Scheduled maintenance, fuel or weather interruptions, regulatory curtailments, and market-driven dispatch decisions all shave time off the theoretical maximum. In practice the number can never exceed the availability factor, which represents the upper bound of achievable uptime.
Does Capacity factor apply only to coal or gas plants?
No—the same ratio works for wind turbines, solar arrays, hydroelectric dams, and any other electricity-producing installation. That universality is what makes it a practical yardstick for comparing how effectively different generation technologies deliver relative to their peak potential.
Over what time span is Capacity factor typically reported?
A full calendar year is the most common reporting window, though operators also track monthly figures and lifetime averages. The choice matters because seasonal weather swings, planned outages, and grid-demand patterns can shift the number noticeably between periods.
More in Power Generation 1-20
Spotted an error? Know more?
This is a living reference — every entry is fact-audited, and reader corrections feed straight into our audit queue. Suggest an edit · See this site's audit record