Tally marks
A unary numeral system for counting, often clustered in fives.

новое тождество · Public domain
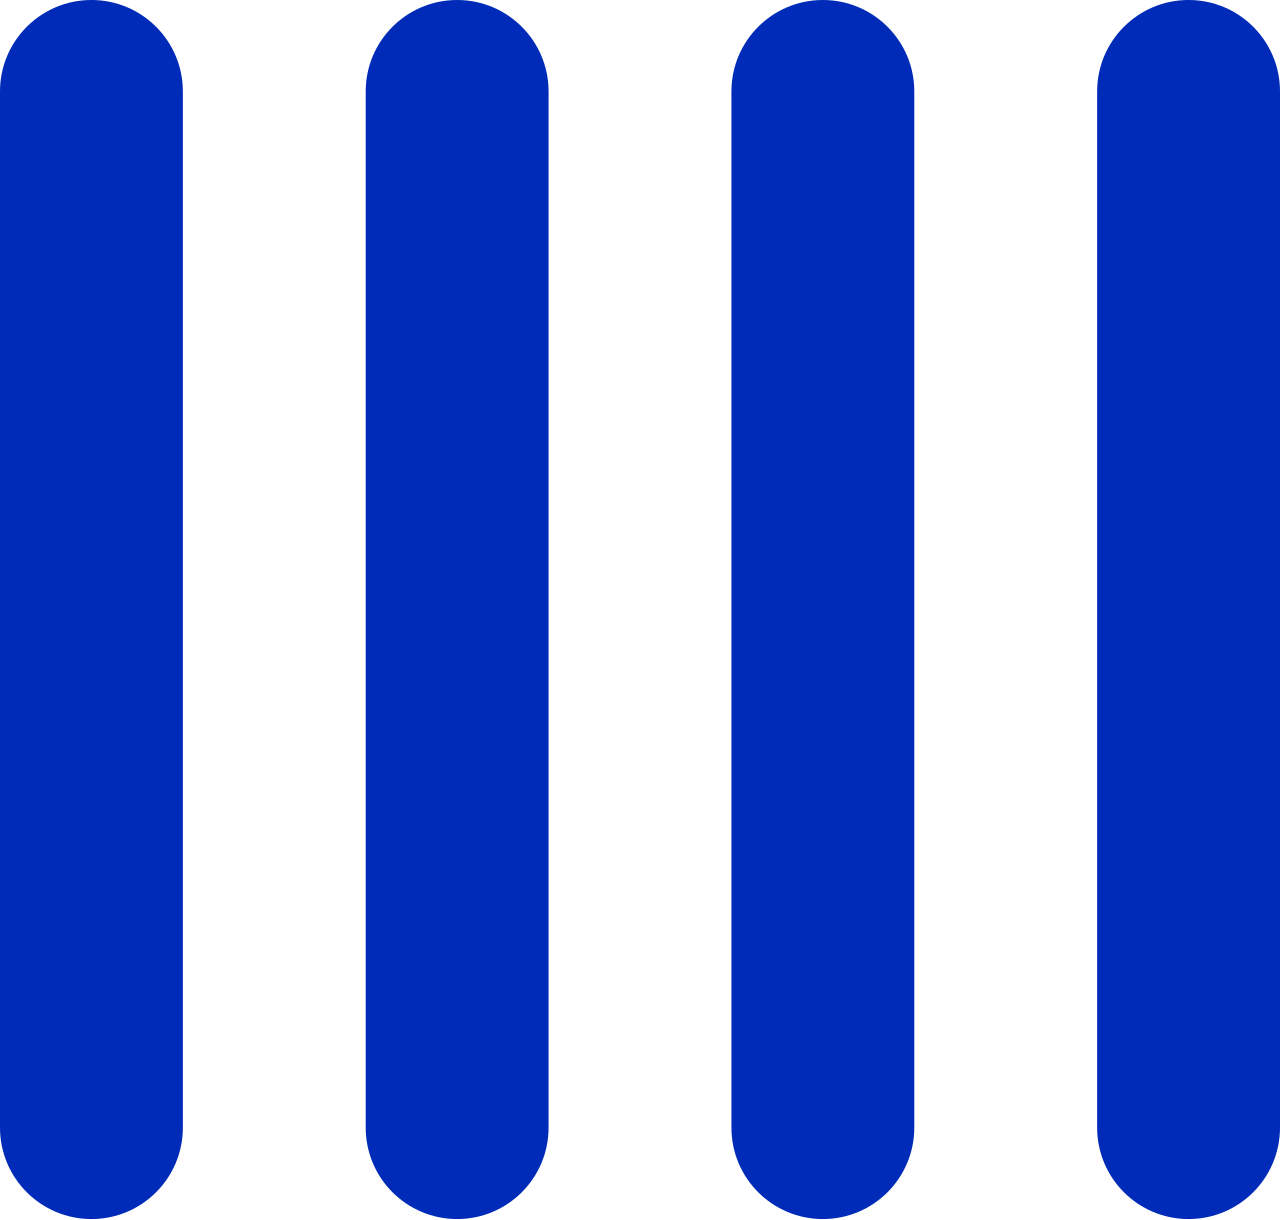
Tally marks, also called hash marks, are used as a basic numeral system for counting; they can be thought of as a unary numeral system. They are most useful in counting (tallying) ongoing results, such as the score in a game or sport, as no intermediate results need to be erased or discarded. However, because of the length of large numbers, tallies are not commonly used for static text. Notched sticks, known as tally sticks, were also historically used for this purpose.
- Field
- Numeral systems, counting aids
- Known for
- Unary counting system used for tallying ongoing results
- Earliest evidence
- Between 35,000 and 25,000 years ago (Upper Paleolithic)
- Notable artifacts
- Wolf bone (c. 30,000 years ago), Ishango bone (over 20,000 years old)
Lore & Background
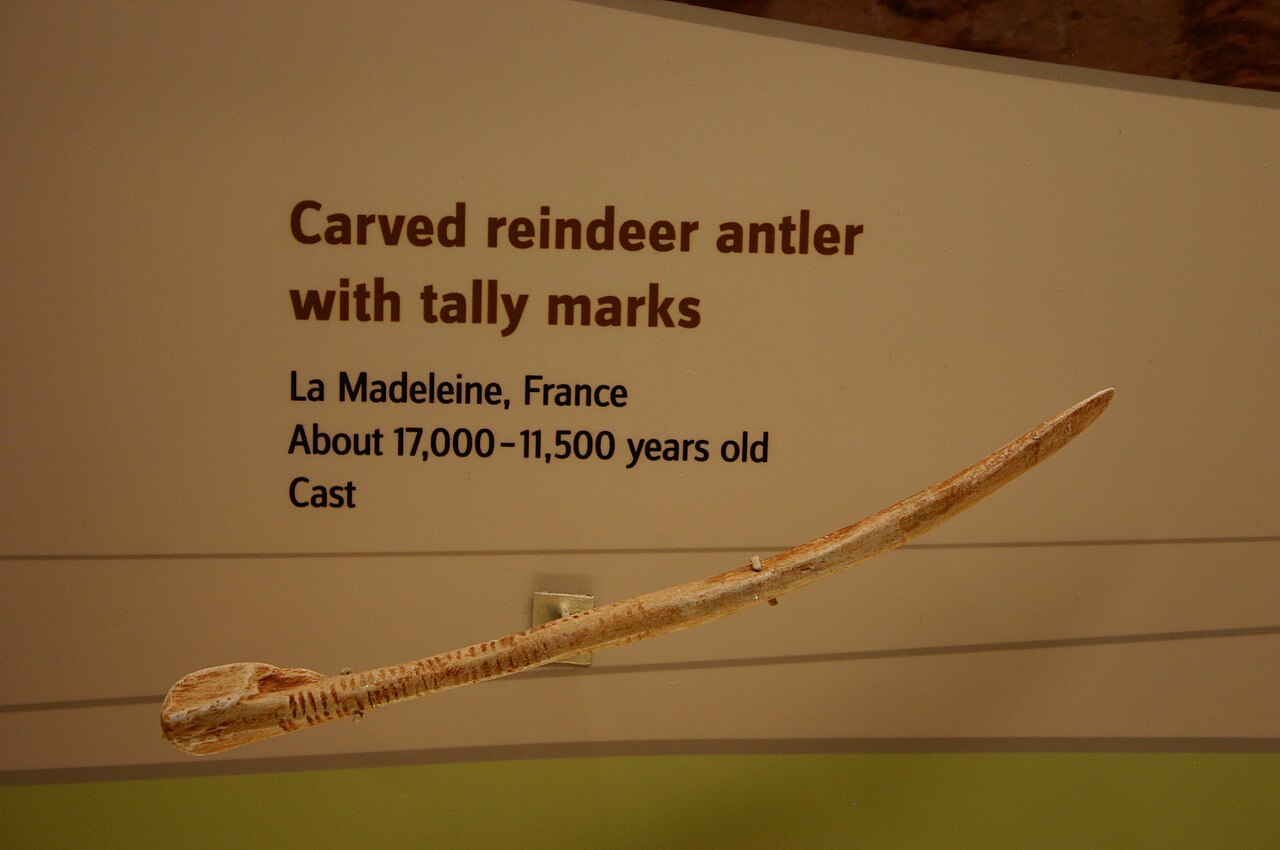
Counting aids other than body parts appear in the Upper Paleolithic. The oldest tally sticks date to between 35,000 and 25,000 years ago, in the form of notched bones found in the context of the European Aurignacian to Gravettian and in Africa's Late Stone Age. The so-called Wolf bone is a prehistoric artifact discovered in 1937 in Czechoslovakia during excavations at Dolní Věstonice, Moravia, led by Karl Absolon. Dated to the Aurignacian, approximately 30,000 years ago, the bone is marked with 55 marks which may be tally marks. The head of an ivory Venus figurine was excavated close to the bone. The Ishango bone, found in the Ishango region of the present-day Democratic Republic of Congo, is dated to over 20,000 years old. Upon discovery, it was thought to portray a series of prime numbers. In the book How Mathematics Happened: The First 50,000 Years, Peter Rudman argues that the development of the concept of prime numbers could only have come about after the concept of division, which he dates to after 10,000 BC, with prime numbers probably not being understood until about 500 BC. He also writes that 'no attempt has been made to explain why a tally of something should exhibit multiples of two, prime numbers between 10 and 20, and some numbers that are almost multiples of 10.' Alexander Marshack examined the Ishango bone microscopically, and concluded that it may represent a six-month lunar calendar. Artifacts in Little Salt Spring demonstrate likely use of a tally system for calendric purposes about 10,000 years ago. Markings on reindeer antler are shown to be consistent with the theory of their usage to track the lunar cycle.
Reader's Guide
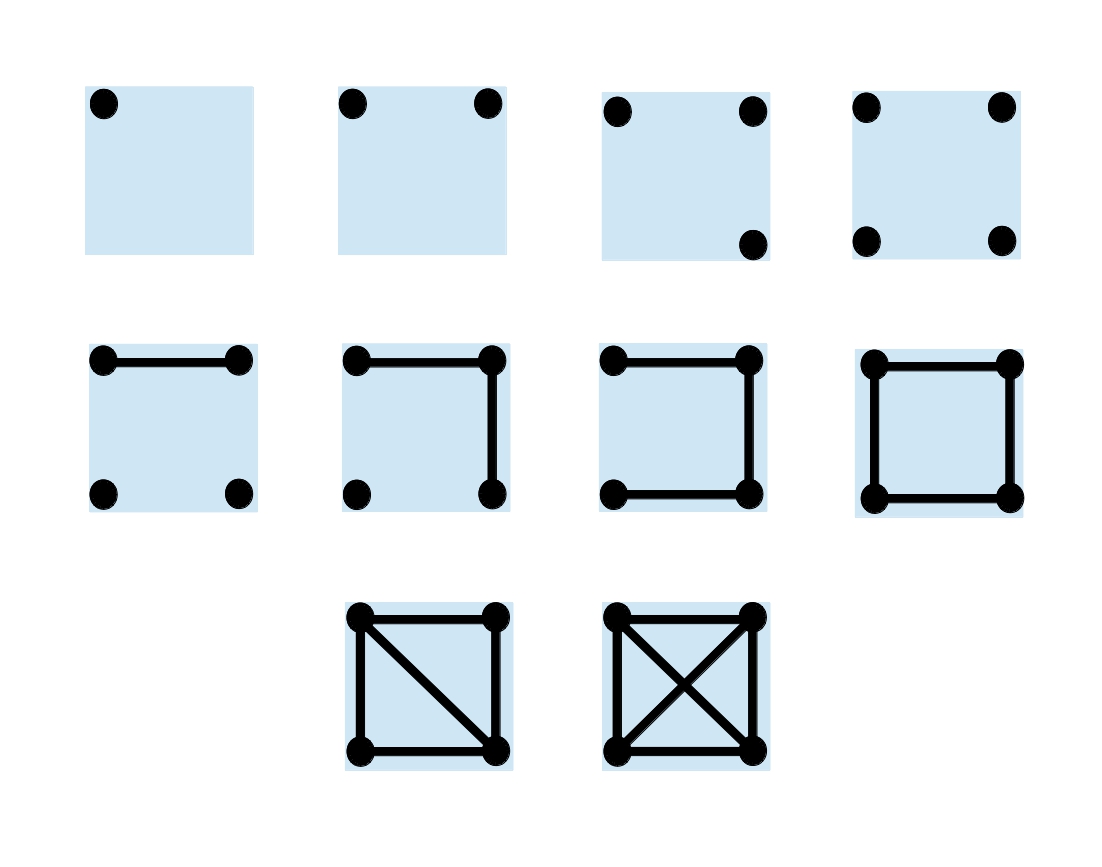
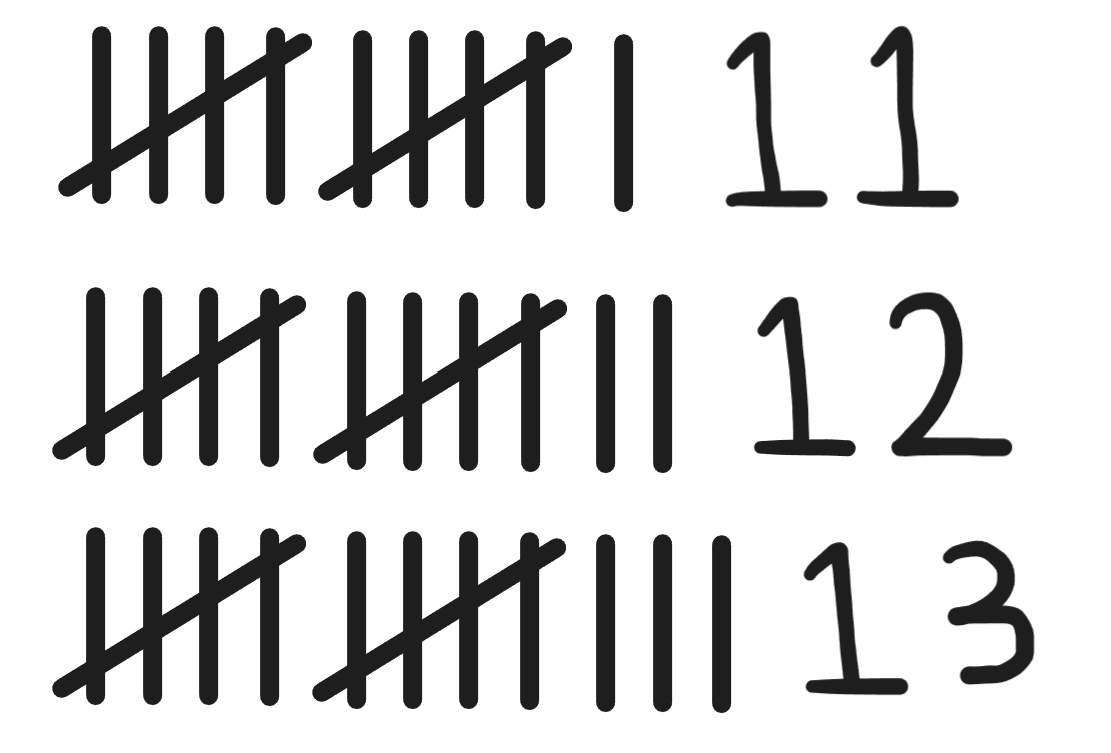
Tally marks are typically clustered in groups of five for legibility. The cluster size 5 has the advantages of (a) easy conversion into decimal for higher arithmetic operations and (b) avoiding error, as humans can far more easily correctly identify a cluster of 5 than one of 10. Various ways to cluster the number eight include writing the first or fifth mark at an angle, forming a 'herringbone' by having the fifth stroke close out a group of five, or crossing the fifth mark diagonally to form a 'five-bar gate'. Roman numerals, the Brahmi and Chinese numerals for one through three (一 二 三), and rod numerals were derived from tally marks, as possibly was the ogham script. Base 1 arithmetic notation system is a unary positional system similar to tally marks. It is rarely used as a practical base for counting due to its difficult readability. Under base 1, the numbers 1, 2, 3, 4, 5, 6 ... would be represented as: 1, 11, 111, 1111, 11111, 111111 ... Base 1 notation is widely used in type numbers of flour; the higher number represents a higher grind. In 2015, Ken Lunde and Daisuke Miura submitted a proposal to encode various systems of tally marks in the Unicode Standard. However, the box tally and dot-and-dash tally characters were not accepted for encoding, and only the five ideographic tally marks (正 scheme) and two Western tally digits were added to the Unicode Standard in the Counting Rod Numerals block in Unicode version 11.0 (June 2018). Only the tally marks for the numbers 1 and 5 are encoded, and tally marks for the numbers 2, 3 and 4 are intended to be composed from sequences of tally mark 1 at the font level.
Did You Know?
- Tally marks are also called hash marks.
- The Wolf bone, dated to approximately 30,000 years ago, is marked with 55 marks which may be tally marks.
- The Ishango bone was initially thought to portray a series of prime numbers.
- Alexander Marshack concluded that the Ishango bone may represent a six-month lunar calendar.
The Foundation of Counting: Absolute, Relative, and Cumulative Frequency
In statistical practice, understanding how often something happens is fundamental. The absolute frequency of a given event simply records how many times that particular observation appeared across an entire experiment or study. Building on that raw count, the relative frequency expresses each event's share of the total sample, essentially asking what proportion of all recorded observations belong to that category. The cumulative frequency takes a different angle: it accumulates the absolute counts of every event up to and including a specific point within an ordered sequence. Together, these three measures give analysts a layered view of their data. They are commonly presented either in tabular layouts or graphical displays, and they serve practical purposes beyond mere description. For example, researchers can employ them as estimators of empirical probabilities or as approximations of cumulative distribution functions, bridging the gap between observed data and theoretical probability models.
The Mathematics Behind the Ratios
The relative frequency of any single event is calculated by dividing its absolute count by the total number of observations across all events. In formulaic terms, this means taking the count for event i and dividing it by the sum of counts for every event in the dataset, yielding a value between zero and one. When the relative frequencies for all events are plotted together, they form what is known as a frequency distribution, offering a visual snapshot of how observations are spread across categories. One practical challenge arises when certain events never occur in the sample, producing a zero count. In such cases, statisticians may introduce pseudocounts—small artificial additions—to prevent mathematical difficulties and ensure that every category retains a nonzero representation. This technique is particularly useful when the goal is to estimate probabilities or model distributions, since a strict zero can distort downstream calculations and obscure the underlying pattern the data is meant to reveal.
From Raw Data to Organized Classes
Constructing a frequency distribution is a step-by-step process that transforms scattered observations into a structured summary. The first decision involves choosing how many classes to create; too many or too few will obscure the natural shape of the data and make interpretation difficult. Two common estimation formulas exist: one multiplies the base-10 logarithm of the sample size by 3.3 and adds one, while the other simply takes the square root of the total observations. However, neither formula is a rigid rule, and the resulting class count may need adjustment depending on the dataset. Next, the range is computed by subtracting the minimum value from the maximum. Dividing that range by the chosen number of classes yields the class width, which is typically kept uniform across all intervals. The starting point of the first class is selected somewhat arbitrarily, often placed slightly below the minimum so that the class midpoint sits in a natural position. Finally, each observation is assigned to its class by marking a vertical tally bar, and a running count is maintained until every data point has been placed.
Seeing the Pattern: Histograms, Bar Charts, and Beyond
Once frequencies are tallied, the real communicative power of the data emerges through visualization. A histogram arranges adjacent rectangles over consecutive, non-overlapping intervals, with each rectangle's area proportional to the number of observations falling in that bin. The height of each bar represents the frequency density—frequency divided by interval width—so the total area of the entire histogram equals the sample size. When normalized, the total area becomes one, and the chart displays relative proportions instead of raw counts. The rectangles deliberately touch one another, signaling that the underlying variable is continuous. A bar chart, by contrast, uses separated rectangular bars whose lengths are proportional to the values they represent, and these can be oriented either vertically or horizontally. Frequency distributions in general are versatile tools: they handle both qualitative and quantitative data and find application in summarizing election outcomes, regional income levels, product sales over a period, and graduate student loan amounts.
Gallery


Frequently Asked Questions
What are tally marks in data visualization?
Tally marks (also known as hash marks) are a basic unary counting system where each individual mark represents one unit. They are primarily used to track ongoing results, such as a running game score, because no intermediate totals need to be erased or recalculated.
How do tally marks work as a numeral system?
Each stroke you add represents a single count, making it a purely unary system. This means there is no positional value or grouping logic beyond the simple act of adding one more mark for each new item or event.
Why aren't tally marks used for large numbers in static text?
Because every single unit requires its own individual mark, representing even a moderately large number produces an unwieldy string of strokes. For that reason, tallies are best suited to short, ongoing tallies rather than recording big figures in a document.
How old is the history of tally marks?
The earliest known counting aids beyond fingers and toes date back to the Upper Paleolithic period, roughly between 35,000 and 25,000 years ago. People at that time carved notches into bones and sticks to keep track of counts, a practice that directly anticipates modern tally marks.
What are some famous early artifacts related to tally marks?
Two well-known examples are the Wolf bone, dating to around 30,000 years ago, and the Ishango bone, which is over 20,000 years old. Both feature notched markings that scholars interpret as early counting or tallying aids.
More in Graphs And Data Visualization 1-24
Spotted an error? Know more?
Reader corrections go straight into our review queue. Suggest an edit · How this site is sourced