Stem-and-leaf display
A graphical tool that retains original data for distribution analysis.

Brigban · CC0
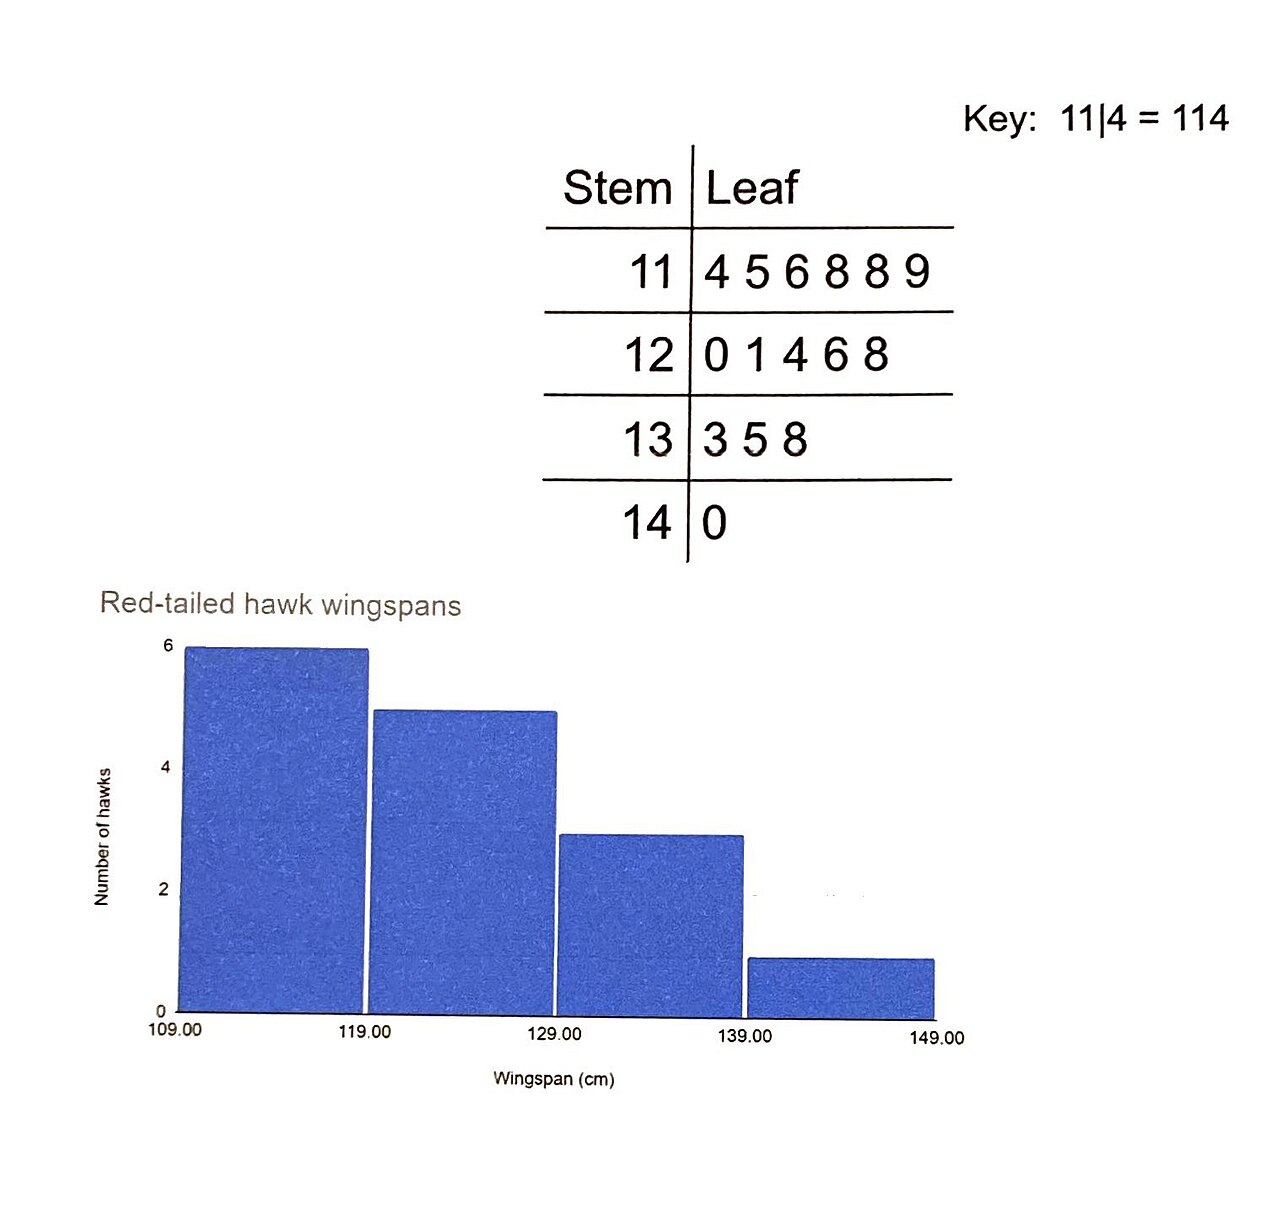
A stem-and-leaf display, also known as a stemplot, is a graphical device for presenting quantitative data that resembles a histogram but retains the original data values. It was introduced by John Tukey in his 1977 book 'Exploratory Data Analysis' and saw a surge in popularity in the 1980s, aided by the ease of producing such plots with monospaced typewriter fonts on early computers. The technique is useful for visualizing the shape of a distribution and easing the move to order-based inference and non-parametric statistics.
- Field
- Exploratory data analysis, statistics
- Known for
- Graphical representation of quantitative data retaining original values
- Related work
- John Tukey (1977 book)
Lore & Background
The stem-and-leaf display was introduced by John Tukey in his 1977 book 'Exploratory Data Analysis'. Its popularity surged in the 1980s, largely because monospaced typewriter typestyles allowed computer technology of the time to easily produce the graphics. Modern computers' superior graphic capabilities have meant these techniques are less often used.
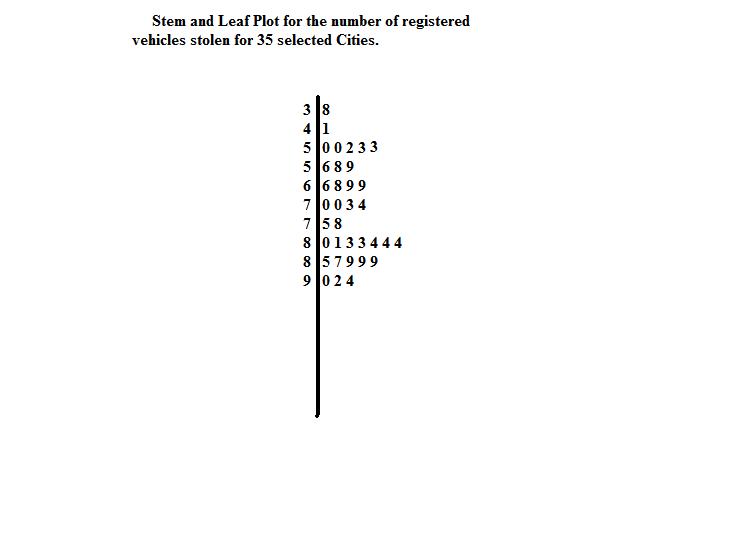
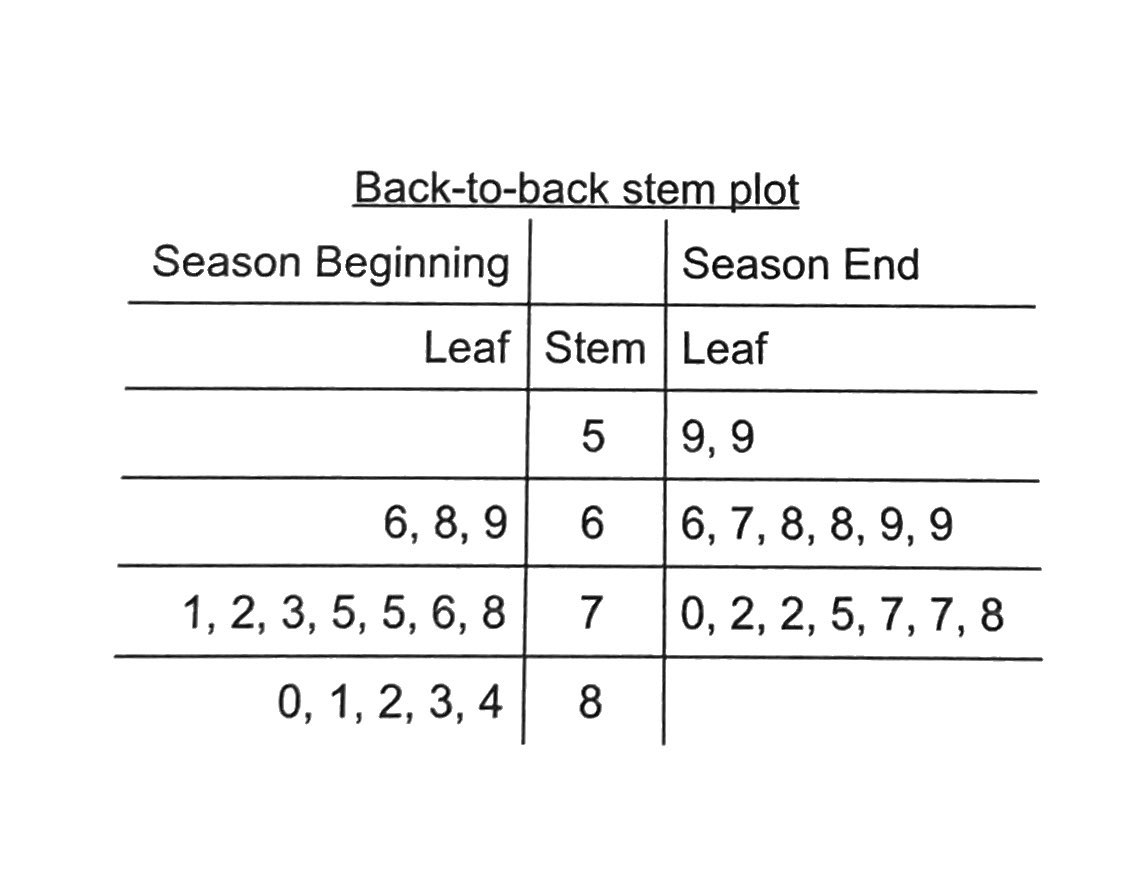
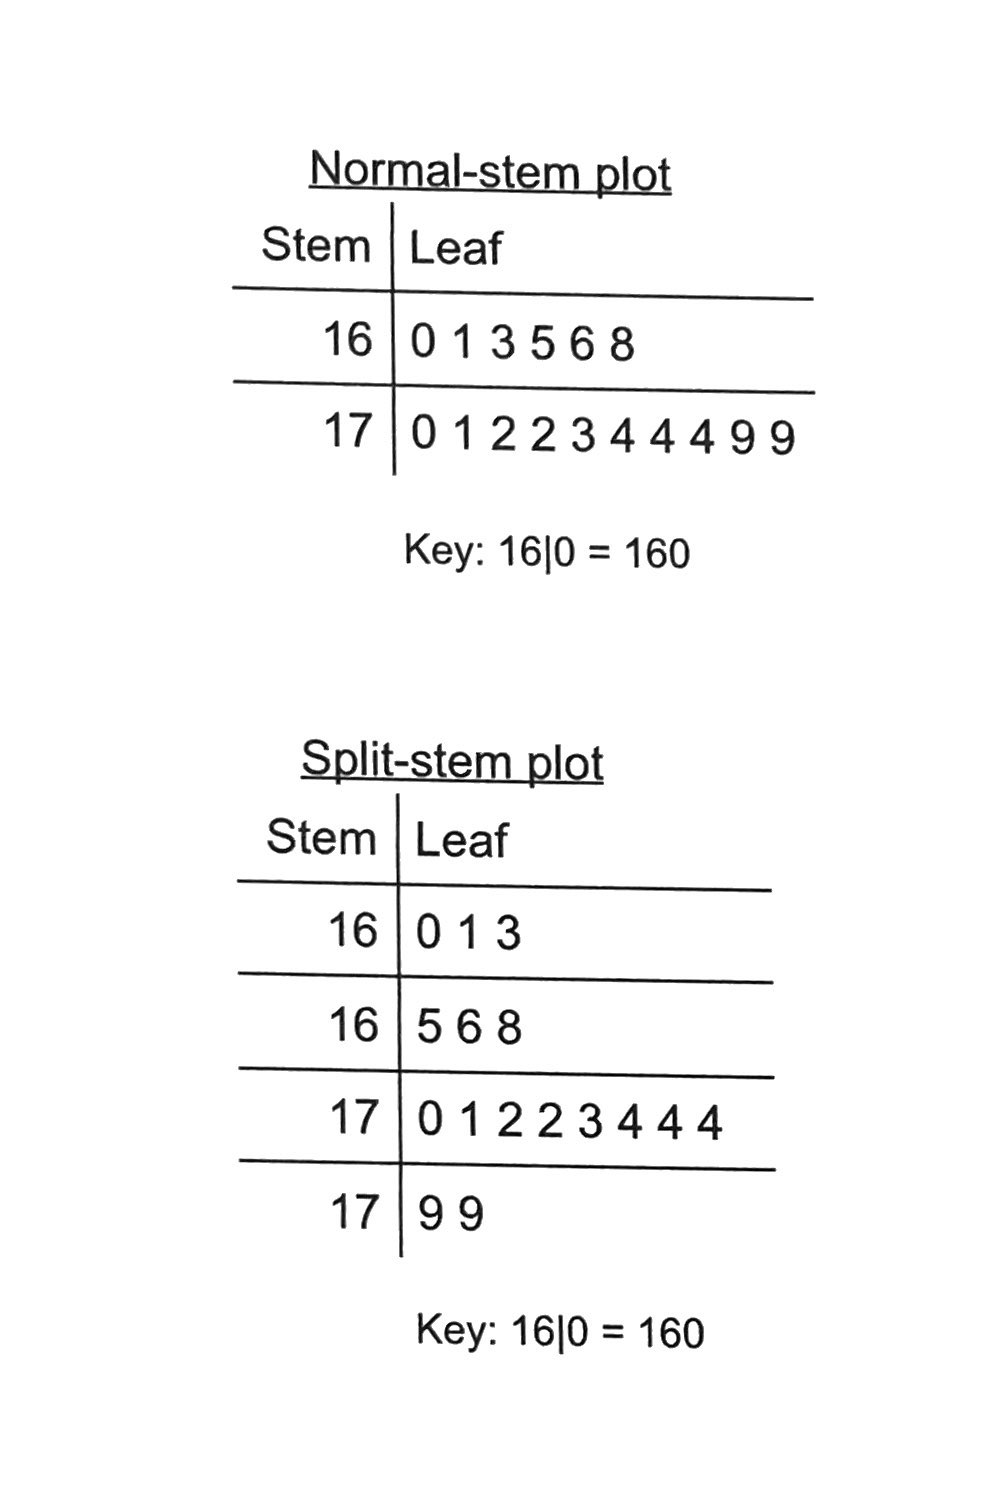
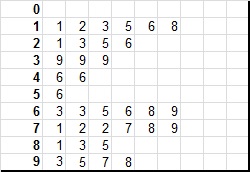
To construct a stem-and-leaf display, observations must first be sorted in ascending order. Typically, the leaf contains the last digit of the number and the stem contains all other digits. For very large numbers, data values may be rounded to a particular place value. The stems are listed to the left of a vertical line, with each stem listed only once and no numbers skipped, even if some stems have no leaves. Leaves are listed in increasing order to the right of each stem.
The display can be transposed to show leaves in vertical columns. Rounding may be needed for non-integer data, and negative numbers are handled by placing a negative sign in front of the stem unit. The stem-and-leaf plot has been implemented in Octave and R.
Reader's Guide
The stem-and-leaf display is significant as a bridge between raw data and graphical representation, preserving the original data to at least two significant digits while showing distribution shape. Unlike histograms, it retains the data in order, facilitating order-based inference and non-parametric statistics. Its rise in the 1980s was tied to the limitations of computer technology at the time, which could easily produce monospaced graphics; modern computers' advanced graphics have reduced its use. The technique remains a useful tool in exploratory data analysis, particularly for small to moderate datasets where retaining exact values is important. The construction process—sorting data, choosing stem and leaf units, and listing stems with leaves—ensures clarity and reproducibility. The display can handle negative numbers and non-integer values through rounding, and it has been implemented in statistical software like Octave and R. Its legacy lies in its simplicity and effectiveness for teaching and initial data exploration.
Did You Know?
- It became more commonly used in the 1980s after the publication of John Tukey's 1977 book on exploratory data analysis.
- Unlike histograms, stem-and-leaf displays retain the original data to at least two significant digits.
Historical Roots and the Typewriter Era
The stem-and-leaf display traces its intellectual origins to the statistical work of Arthur Bowley in the early twentieth century. For decades, the technique remained a relatively niche tool within exploratory data analysis. Its breakthrough moment arrived in 1977, when John Tukey published his influential book on exploratory data analysis, which brought the plot into much wider academic and professional use. Throughout the 1980s, the stem-and-leaf display enjoyed a marked surge in popularity, and the driving reason was largely practical: the graphics of that era relied on monospaced, typewriter-style fonts, and the stem-and-leaf format was perfectly suited to being rendered in plain text on early computer terminals. As modern operating systems and software gained the ability to produce rich, color-coded visualizations, the practical necessity for a text-based distribution plot gradually diminished. Today the technique is still taught and occasionally employed, but it has been largely supplanted by more visually sophisticated alternatives that contemporary hardware can generate effortlessly.
Building the Display: A Step-by-Step Process
Constructing a stem-and-leaf display begins with a single prerequisite: the data set must be arranged in ascending order. When working by hand, a practical approach is to first sketch a rough version with the leaves in whatever order they appear, then go back and sort each row of leaves into increasing sequence. The next decision is defining what the stem and leaf represent. In the most common convention, the leaf holds the ones digit while the stem captures every digit to its left. For data sets involving very large numbers, the analyst may round values to a chosen place value—say the hundreds—and let that rounded digit serve as the leaf, with all remaining higher-order digits forming the stem. The finished plot is laid out as two columns divided by a vertical line: stems appear on the left, each written exactly once with no gaps, even if a particular stem has no leaves at all. Leaves are written in ascending order to the right of their stem. If a value appears more than once, every instance must be shown. The display can also be transposed so that leaves run in vertical columns rather than horizontal rows.
Why It Matters: Advantages Over the Histogram
Although a stem-and-leaf display and a histogram both serve to reveal the shape of a quantitative distribution, the stem-and-leaf plot carries a distinct statistical advantage: it preserves the individual data values to at least two significant digits. In a histogram, once observations are binned into bars, the exact values are lost. The stem-and-leaf format, by contrast, keeps every original value visible and simultaneously arranges them in ascending order. This dual property—retention of raw information combined with automatic sorting—makes the plot a natural bridge into order-based inference and non-parametric statistical methods, where the rank and relative position of each observation matter more than its exact magnitude. Because the technique was designed from the outset to support exploratory data analysis, it gives analysts an immediate, low-commitment way to inspect the overall shape and spread of a distribution before committing to a more formal modeling approach. The result is a quick, transparent diagnostic that requires no software and no loss of the underlying data.
Terminology Confusion and Modern Software Support
One source of persistent confusion in the statistical literature is the term 'stemplot.' While many readers assume it is simply a shorter name for the stem-and-leaf display, the term frequently refers to an entirely different chart type. In that alternative usage, a simple stem plot involves plotting a matrix of y-values against a shared x-axis, marking the common x-value with a vertical line, and denoting each individual y-value with a symbol placed along that line. This distinction matters for anyone searching software documentation or reading older papers, because the two chart types serve different analytical purposes. On the software front, the stem-and-leaf display has been implemented in both Octave and R, ensuring that analysts working in those environments can still generate the plot programmatically. However, the superior graphic capabilities of modern computing have reduced the frequency with which this text-based technique is the first choice for distribution visualization, and the plot now occupies a more specialized niche than it did during its 1980s heyday.
Gallery
Frequently Asked Questions
Who is Stem-and-leaf display?
It is a graphical technique in exploratory data analysis and statistics that plots quantitative data in a format resembling a histogram while keeping every individual observation visible. It is also commonly called a stemplot.
What are Stem-and-leaf display's powers and role?
Its defining strength is showing the overall shape of a distribution without discarding any raw values into anonymous bins. That dual function makes it a natural on-ramp for order-based inference and non-parametric statistical methods.
Why is Stem-and-leaf display important?
Because it preserves every original data point, analysts can read both the distribution's shape and the exact values from a single picture. That makes it especially handy for small-to-medium datasets where individual observations still carry meaning.
What is Stem-and-leaf display's origin story?
The earliest roots go back to Arthur Bowley's statistical work in the early 1900s, but the display as most people know it was shaped and popularized by John Tukey's 1977 book on exploratory data analysis. From there it became a standard classroom and field tool throughout the 1980s and beyond.
More in Graphs And Data Visualization 1-24
Spotted an error? Know more?
Reader corrections go straight into our review queue. Suggest an edit · How this site is sourced