Ice hockey statistics
Statistics tracked for teams, players, and goaltenders in ice hockey.

Ice hockey statistics are numerical data tracked for teams, individual players, and goaltenders to measure performance and outcomes. They are commonly used in leagues and by analysts to evaluate games, standings, and player contributions.
- Team statistics
- Includes GP, W, L, T, OTL, SOL, PTS, GF, GA, OTW, SOW, ROW, STK, GD
- Individual statistics
- Includes GP, G, A, PTS, S, PN, PIM, PPG, PPA, SHG, SHA, GWG, GTG, ENG, OTG, +/-, TOI, ATOI, HIT, AAV
- Goaltender statistics
- Includes GP, G, A, GS, MIN, GA, GAA, W, L, T, SOG, SV, SVP, SO, ENG
- Points calculation
- 2 points for a W, OTW, or SOW; 1 point for a T, OTL, or SOL; zero for a L
- Plus minus
- Number of team even strength or shorthanded goals for minus against while player is on ice
Lore & Background
The article lists team statistics such as winning or losing streaks (STK), goal difference (GD), games played (GP), wins (W), losses (L), ties (T), overtime losses (OTL), shootout losses (SOL), and points (PTS). It notes that the NHL no longer uses ties, instead determining games by overtime or shootout, and that many leagues do not separate overtime losses and shootout losses. Individual statistics include goals (G), assists (A), points (PTS), shots on goal (S), penalties (PN), penalty minutes (PIM), power play goals (PPG), shorthanded goals (SHG), game-winning goals (GWG), game-tying goals (GTG), empty net goals (ENG), overtime goals (OTG), plus/minus (+/-), time on ice (TOI), hits (HIT), and average annual value (AAV). Goaltender statistics include games started (GS), minutes (MIN), goals against (GA), goals against average (GAA), wins (W), losses (L), ties (T), shots on goal (SOG), saves (SV), save percentage (SVP), shutouts (SO), and empty net goals (ENG). The article also mentions less common terms such as faceoff wins, takeaways, giveaways, blocked shots, and point shares.
Reader's Guide
The significance of ice hockey statistics lies in their use for evaluating team and player performance, determining standings, and breaking ties. Team points are calculated from wins, overtime wins, shootout wins, ties, overtime losses, and shootout losses, with specific point values assigned. The article notes that the NHL no longer uses ties, and that overtime losses and shootout losses are often combined in statistics. For individual players, scoring points are the sum of goals and assists, while plus/minus measures net goals for and against while on the ice. Goaltender statistics include goals against average and save percentage, which are key metrics for performance. The article also highlights that plus/minus is not recorded for goaltenders. These statistics are foundational for analytics in ice hockey, as referenced in the 'See also' section mentioning 'Analytics (ice hockey)' and 'Shot quality'.
Did You Know?
- The NHL no longer uses ties; games are determined by overtime or shootout.
- A game-winning goal is defined as the goal that would make the team win without scoring any more goals.
- For goaltenders, a win or loss is credited when they are on the ice for the game-winning goal or were pulled for an extra attacker immediately before.
From Curling Courses to Hockey Ice: The Rink's Origins
The word "rink" carries a surprisingly old lineage. Rooted in Scots, the term originally meant "course" and was applied to the playing surface of curling long before hockey ever claimed it. In the earliest days of the sport, ice hockey was played on surfaces built for curling, and the name simply stuck even after dedicated hockey facilities were constructed. The physical template we recognize today traces back to the Victoria Skating Rink in Montreal, which opened in 1862. That venue hosted the first indoor hockey game in 1875, and its ice surface measured 204 by 80 feet — dimensions that would influence rink design for generations. The distinctive rounded corners that define every modern sheet of ice are credited to the Montreal Arena, built in 1898, which introduced the curved corner design that replaced the sharp angles of earlier rectangular surfaces. What began as a borrowed curling course in a small Canadian city ultimately became the universal geometry of a global sport, with its proportions and corner radii refined over more than a century of play.
Two Standards, One Game: North American and International Dimensions
Ice hockey operates under two distinct dimensional philosophies, and the difference is not merely academic. North American rinks follow NHL specifications of 200 by 85 feet with a 28-foot corner radius, while international rinks governed by the IIHF measure 60.0 metres in length and between 26.0 and 30.0 metres in width, with corner radii ranging from 7.0 to 8.5 metres. The most consequential gap lies in width: the North American sheet is 13.4 feet narrower than the international standard, producing a noticeably different width-to-length ratio that shapes how space is used on the ice. Goal lines sit 11 feet from the end boards in the NHL but only 4.0 metres in the IIHF. Blue lines, which divide the rink into three zones, are spaced 50 feet apart in North America and 15.0 metres apart internationally — exactly one-quarter of the total rink length under IIHF rules. These seemingly modest measurements alter the geometry of every pass, every breakout, and every defensive coverage scheme a player executes.
Painted Lines, Blue Circles, and the Architecture of Play
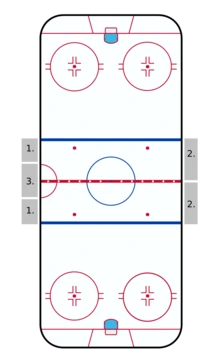
A hockey rink is a carefully layered diagram of rules rendered in paint. The thick red centre line, which must carry a distinctive repeating pattern to distinguish it from the solid blue lines, serves as the reference for icing calls and, in some leagues, two-line pass violations. Two blue lines split the ice into three zones and govern offside: an attacking player who crosses into the opponent's zone before the puck is offside. Thin red goal lines at each end determine whether a goal counts and inform icing decisions. Nine faceoff spots are distributed across the sheet — two in each defensive zone, two in the neutral zone, and one at centre ice. The centre circle is blue, 30 feet in diameter with a 2-inch outline, surrounding a 12-inch solid blue dot. All other faceoff circles are red, 2 feet in diameter, with two vertical red lines painted 3 inches from each inner edge. At each end, the goal opening measures 72 inches wide by 48 inches tall, and the crease — typically painted blue — extends 4.5 feet from the goal line with a 6-foot-radius arc connecting its sides.
The Brodeur Trapezoid: When Rules Target a Player's Strength
In the 2004–05 American Hockey League season, a seven-week experiment introduced what quickly became known as the goaltender trapezoid. The rule restricted where a netminder could legally handle the puck behind the goal line, confining possession to a symmetrical trapezoid whose bases run along the goal line and the end boards. If a goaltender touched the puck outside that zone, a minor penalty for delay of game was assessed and served by a teammate. The motivation was explicitly to promote game flow and sustain offensive pressure by limiting the ability of a goalie to retrieve and clear the puck. The rule was widely understood as a direct response to goaltenders with exceptional puck-handling skills, most notably Martin Brodeur, who played for the New Jersey Devils and later the St. Louis Blues. His nickname for the rule — the "Martin Brodeur Rule" — captured the perception that the trapezoid was designed to neutralize a specific player's greatest asset. Whether the experiment ultimately changed the broader game or simply highlighted how individual talent can reshape the rules around it remains a point of ongoing debate among fans and analysts.
Frequently Asked Questions
What are ice hockey statistics?
Ice hockey statistics are the numerical records kept for teams, individual skaters, and goaltenders to quantify performance and game outcomes. Leagues and analysts rely on these numbers to assess standings, evaluate players, and break down how games unfolded.
How are team points calculated in the standings?
A team earns two points for any win—whether in regulation, overtime, or a shootout—and one point for an overtime or shootout loss. A regulation loss produces zero points, and the PTS column in the standings is simply the season total of all these awards.
What does the plus-minus (+/-) stat actually measure?
Plus-minus tracks the difference between even-strength or shorthanded goals scored by your team versus goals against while a specific player is on the ice. A positive number means more goals for than against during that player's shifts, while a negative number indicates the opposite.
What do GAA and SVP mean for a goaltender?
GAA (Goals Against Average) shows the average number of goals a goalie concedes per 60 minutes, while SVP (Save Percentage) represents the fraction of shots on target they successfully stop. Together with stats like SO (shutouts) and MIN (minutes played), they give a complete picture of goaltending performance.
What individual player statistics are tracked in a season?
Beyond the familiar G, A, and PTS, individual stats include shots (S), penalty minutes (PIM), power-play and shorthanded goals and assists, game-winning and game-tying goals, and plus-minus. Additional tracking covers time on ice (TOI), average time on ice (AVOI), hits, and average against value (AAV).
More in Ice Hockey Rules and Play 1-18
Spotted an error? Know more?
Reader corrections go straight into our review queue. Suggest an edit · How this site is sourced