Analytics in ice hockey
Analytics uses statistics to measure player and team performance in ice hockey.

Analytics in ice hockey is the analysis of the characteristics of hockey players and teams through the use of statistics and other tools to gain a greater understanding of the effects of their performance. Three commonly used basic statistics are Corsi and Fenwick, which use shot attempts to approximate puck possession, and PDO, often considered a measure of luck. Newer statistics such as RAPM (regularized adjusted plus-minus) and xG (expected goals) have been created recently in hockey, though they existed in other sports before.
- Nhl partnership year
- The NHL partnered with SAP SE to create an enhanced statistical package that coincided with the launch of a new website during the 2014–15 season.
Lore & Background
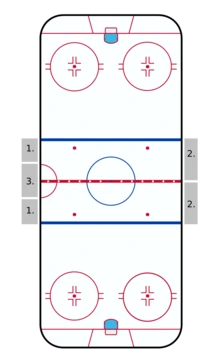
Hockey Hall of Fame coach Roger Nielson is credited as an early pioneer of analytics, using measures of his own invention as early as the late 1960s during his tenure with the Peterborough Petes. In modern usage, analytics have traditionally been the domain of hockey bloggers and amateur statisticians. They have been increasingly adopted by National Hockey League (NHL) organizations themselves, and reached mainstream usage when the NHL partnered with SAP SE to create an 'enhanced' statistical package that coincided with the launch of a new website featuring analytical statistics during the 2014–15 season. Corsi, called shot attempts (SAT) by the NHL, is the sum of shots on goal, missed shots and blocked shots. It is named after coach Jim Corsi but was developed by an Edmonton Oilers blogger and fan to better measure the workload of a goaltender. Fenwick, called unblocked shot attempts (USAT) by the NHL, counts only shots on goal and missed shots; blocked shots are not included. It is named after blogger Matt Fenwick and is viewed as having a stronger correlation to scoring chances. PDO, called SPSV% by the NHL, is the sum of a team's shooting percentage and its save percentage multiplied by 100. PDO is not an acronym; it comes from the online handle of Brian King, the first to propose it. Zone starts is the ratio of how many face-offs a player is on for in the offensive zone relative to the defensive zone. A high zone start ratio often increases Corsi numbers, while a low ratio depresses them. In recent time, the use of zone starts in analysis has decreased. Newer statistics include RAPM, which uses a mathematical model with ridge regression to isolate a player's play driving ability, and xG, which gives each shot attempt a value depending on shot location and type.
Reader's Guide
Analytics in ice hockey has shifted from amateur and blogger-driven efforts to mainstream adoption by NHL organizations, particularly after the league's partnership with SAP SE in the 2014–15 season. The core statistics—Corsi, Fenwick, and PDO—provide foundational measures of puck possession, scoring chances, and luck, respectively. Corsi approximates shot attempt differential and can predict future goal differentials; a team with a high Corsi but losing goal differential is expected to improve. Fenwick, by excluding blocked shots, better correlates with scoring chances and is the basis for most expected goals models. PDO, typically regressing toward 100, helps identify teams or players performing above or below their true ability.
Newer metrics like RAPM and xG address limitations of older stats. RAPM isolates a player's play-driving ability by adjusting for factors such as teammates, competition, zone starts, and score effects. xG values shot quality based on location and type, solving Corsi's problem of treating all shots equally. Score effects and situational modifiers, such as Corsi close and Corsi tied, have been used to account for game state, though unadjusted Corsi has been found to predict future goals as well or better. The ongoing development of analytics continues to refine how player and team performance is understood.
Did You Know?
- On-the-fly shifts account for more than half (58%) of all shifts, reducing the usefulness of zone starts.
- A shot from the slot might get an xG score of 0.30, while a shot from the point may get only 0.02.
Frequently Asked Questions
What is analytics in ice hockey?
It is the practice of applying statistics and specialized tools to break down how players and teams actually perform on the ice. Rather than relying only on traditional box-score numbers, it digs into the underlying effects and patterns of in-game play.
What are Corsi and Fenwick in hockey?
These are two shot-attempt-based metrics used as rough proxies for puck possession. Corsi tallies all shot attempts for and against a player or team, while Fenwick narrows the count to only those attempts that miss the net.
What does PDO measure in ice hockey?
PDO is a combined figure that adds a team's shooting percentage and save percentage together. It is widely treated as a rough gauge of how much short-term luck a team is experiencing over a stretch of games.
What are xG and RAPM in hockey?
Expected goals (xG) estimates the quality of scoring chances a player or team generates, while RAPM (regularized adjusted plus-minus) attempts to isolate an individual's true impact on goal differential. Both concepts were adapted from other sports before being applied to hockey.
When did the NHL officially embrace advanced analytics?
The league partnered with SAP SE to roll out an enhanced statistical package alongside a redesigned website during the 2014–15 season. That move marked a broader institutional commitment to data-driven evaluation beyond basic scoring stats.
More in Ice Hockey Rules and Play 1-18
Spotted an error? Know more?
Reader corrections go straight into our review queue. Suggest an edit · How this site is sourced