Probability distribution
Mathematical description of probabilities for random phenomena.
Last updated

Incnis Mrsi ( talk ) · Public domain
A probability distribution is a mathematical description of the probabilities of events, which are subsets of the sample space—the set of all possible outcomes of a random phenomenon. The sample space can be any set, such as the outcomes of a coin flip or the numbers on a die. To define these distributions for random variables, which map outcomes to values like real numbers, a common distinction is made between discrete and continuous cases.
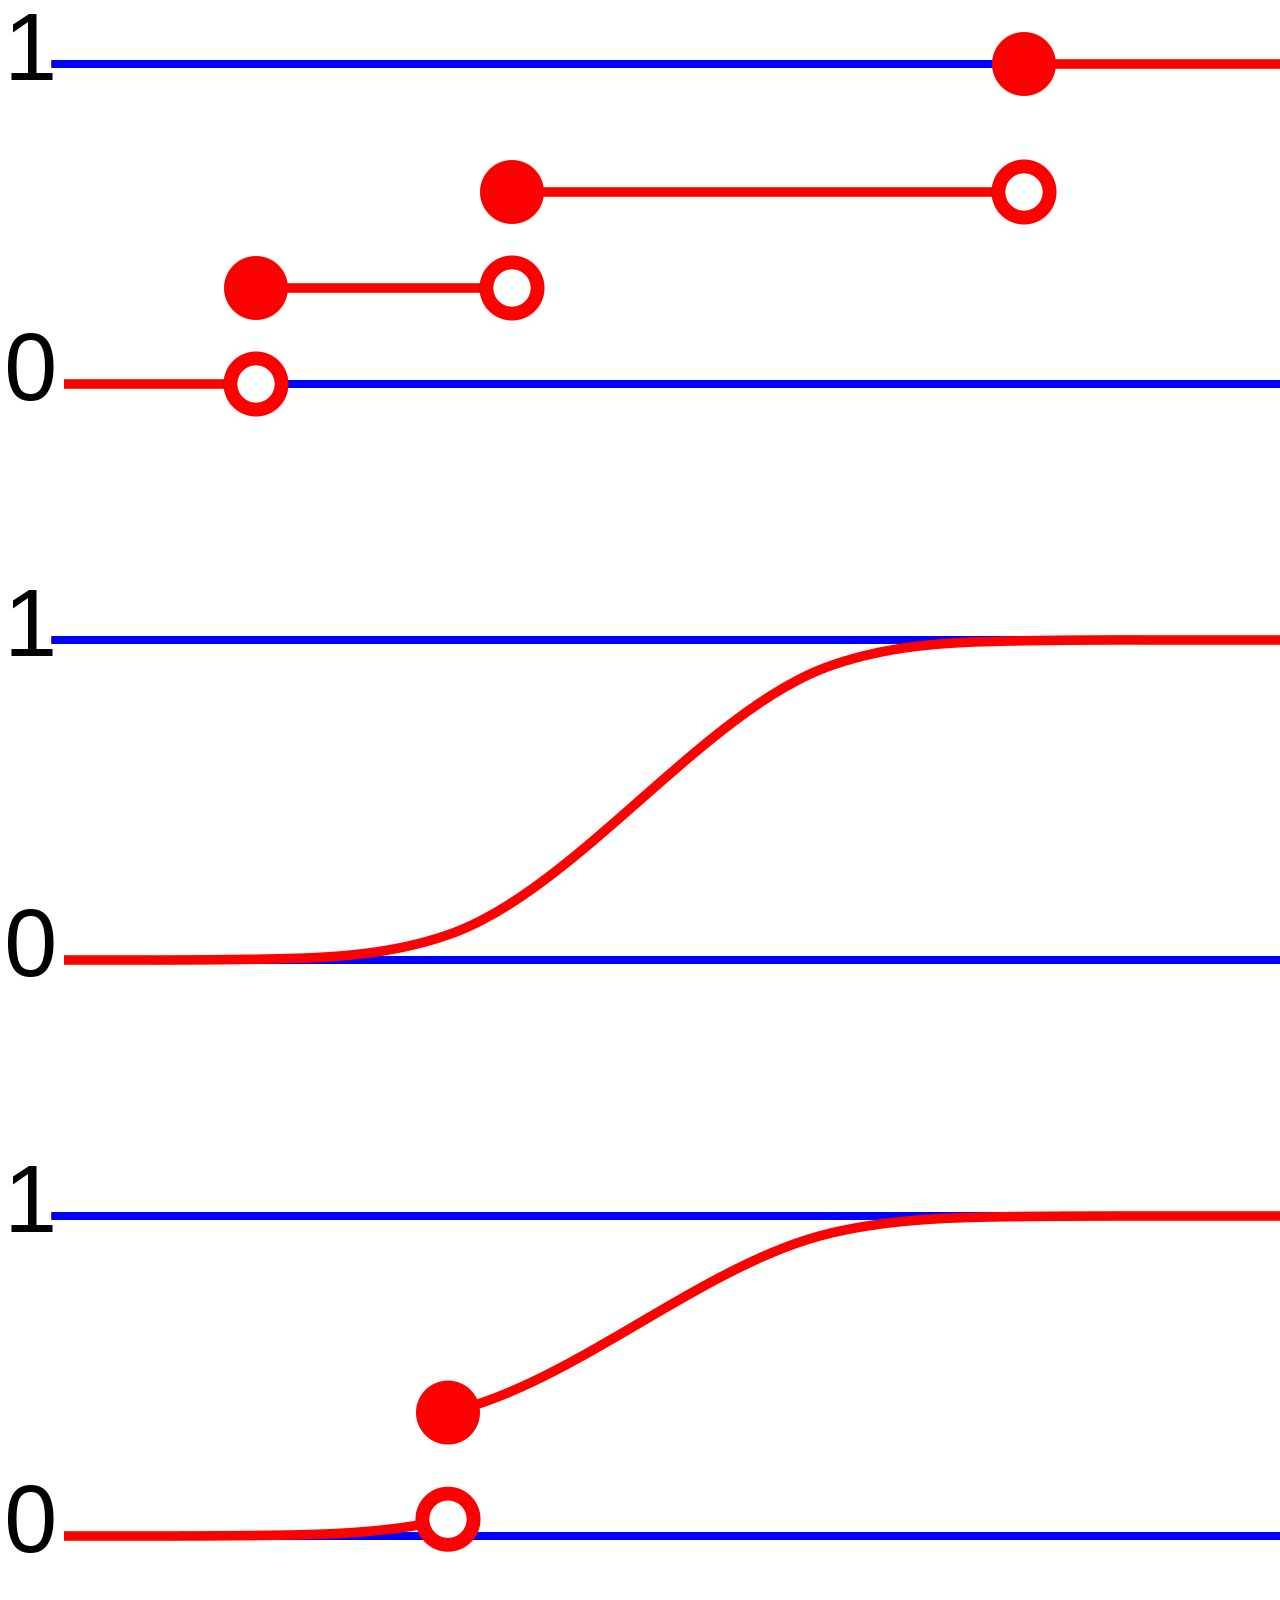
For discrete random variables, a probability mass function assigns a probability to each possible outcome; the probability of an event is then the sum of the probabilities of the outcomes that satisfy it. For example, with a fair die, each face has a probability of one-sixth, and the probability of rolling an even number is the sum of the probabilities for two, four, and six. In contrast, for continuous random variables, any single outcome has a probability of zero unless the probability density function has infinitely-dense peaks. Only events containing infinitely many outcomes, such as intervals, have a probability greater than zero.
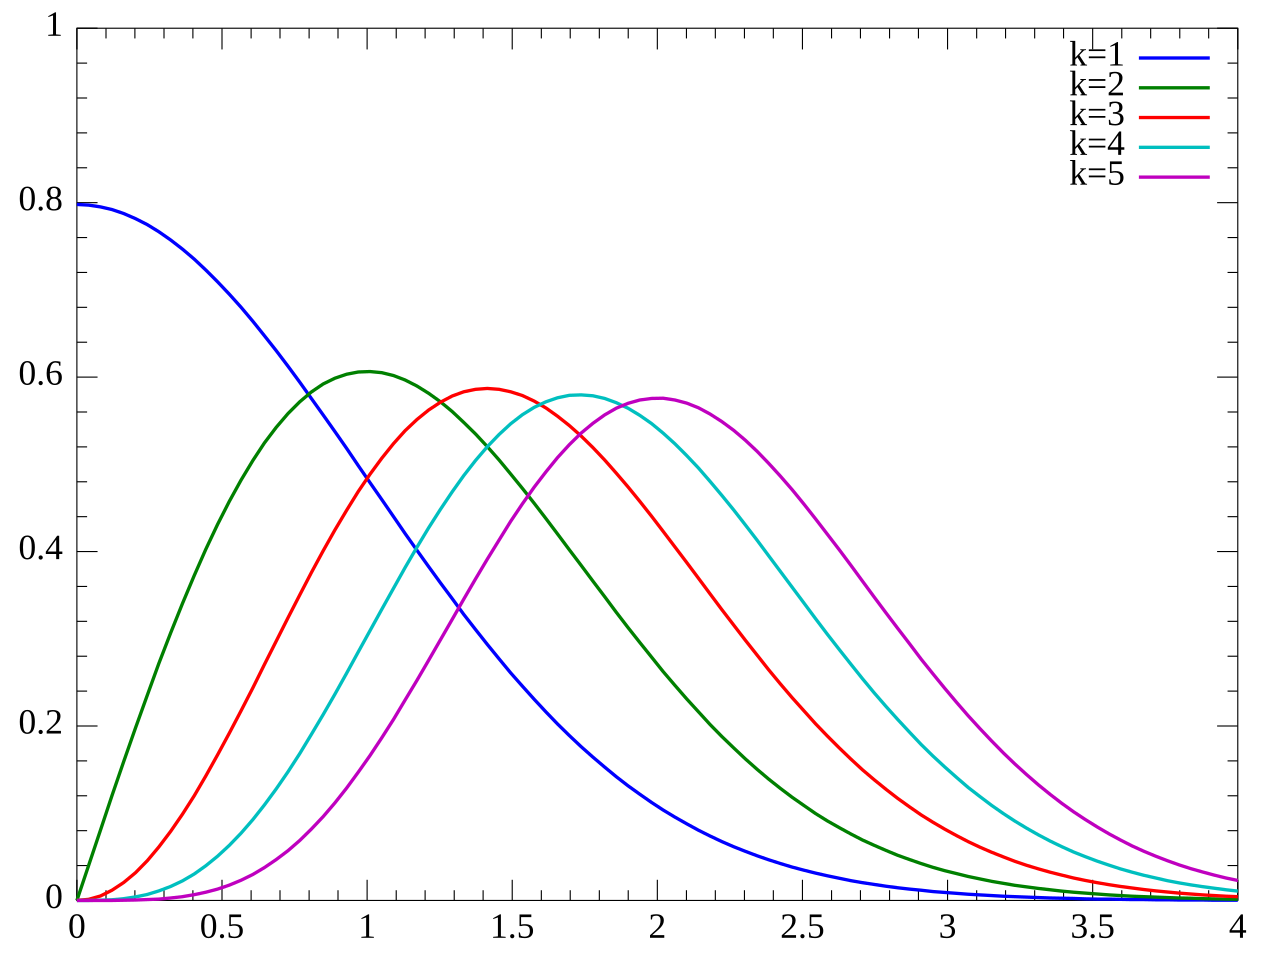
For instance, the exact weight of a ham measured with infinite precision would have zero probability, but a quality control requirement that a package weigh between 490 and 510 grams is possible because it does not require infinite precision. Continuous distributions are often described by a cumulative distribution function, which gives the probability that the random variable is no larger than a given value, or by a probability density function, where the probability of a variable falling in an interval is found by integrating the density over that interval. Most common continuous distributions are absolutely continuous, allowing such density-based descriptions.
Quick Facts
- Field
- Probability theory and statistics
Facts from the source article.
Lore & Background
In probability theory and statistics, a probability distribution describes how probabilities are assigned to the possible results of a random phenomenon—more precisely, to events, which are sets of possible outcomes of a probabilistic experiment. Informally, a probability distribution tells us how likely different results are. Formally, it is a probability measure: a function that assigns probabilities to events in a way that satisfies the axioms of probability.
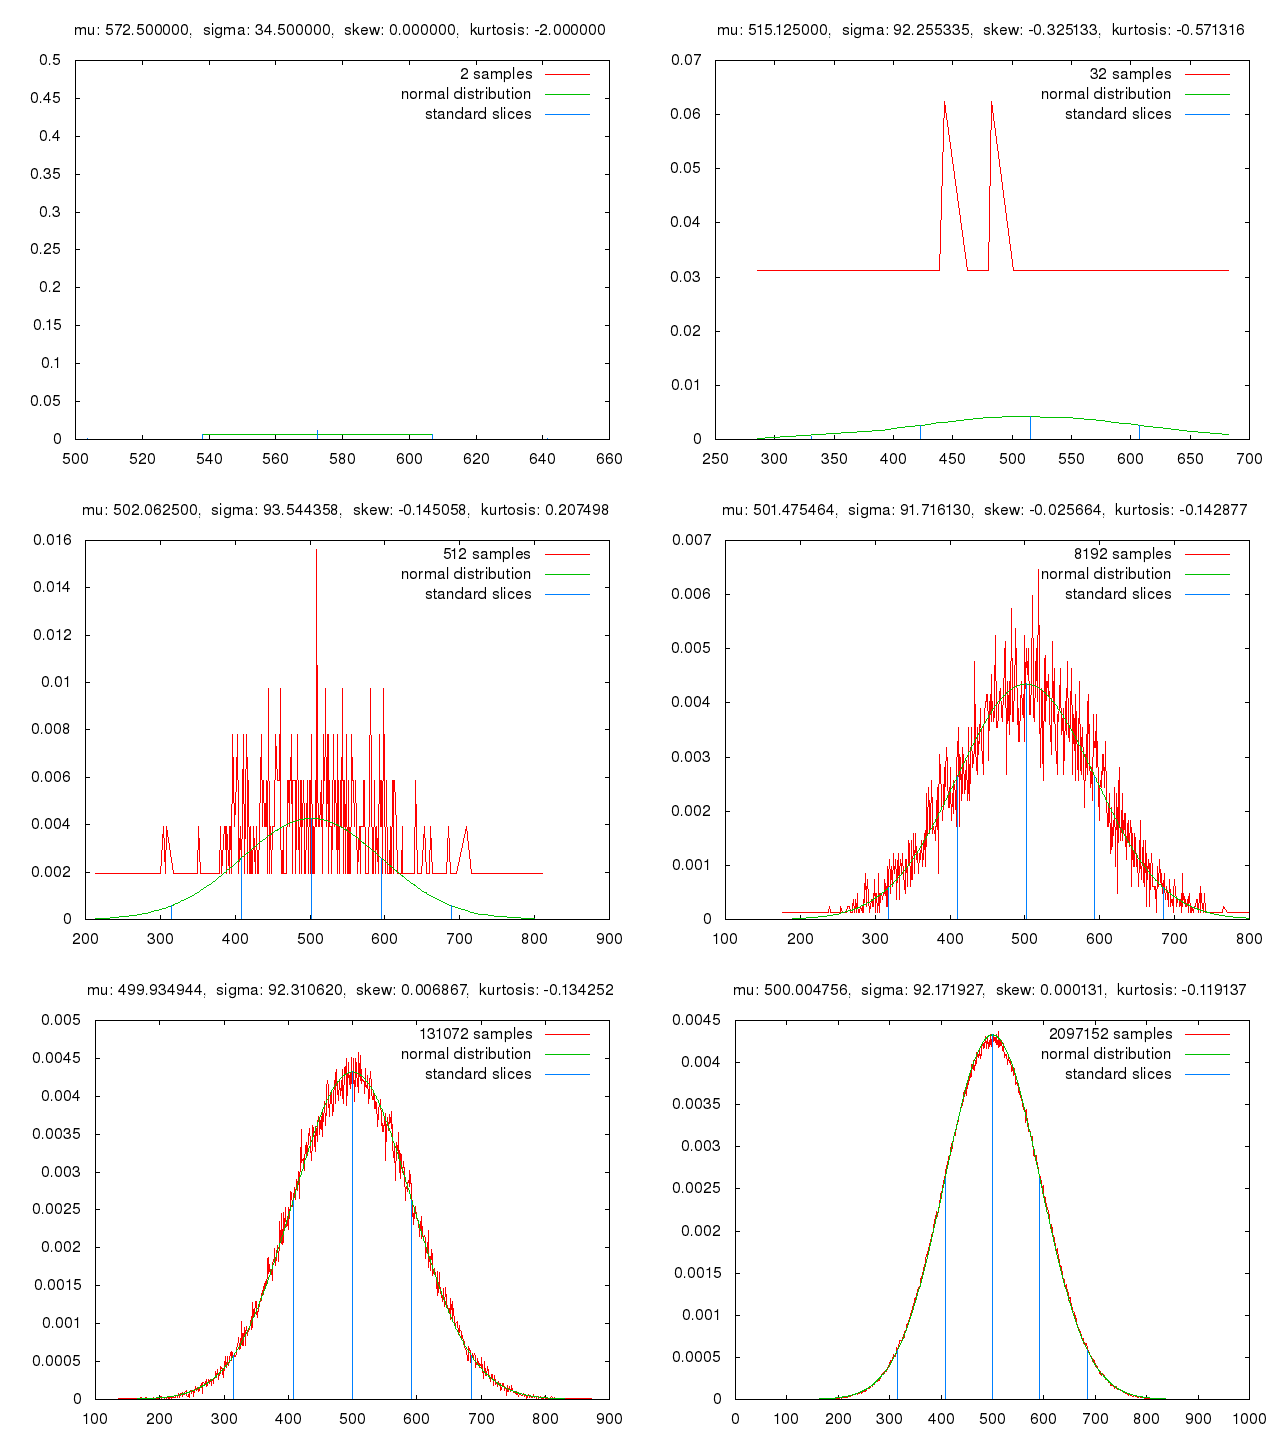
Probability distributions are closely linked to random variables. A random variable is a function that assigns a value to each outcome of a probabilistic experiment; it induces a probability distribution on the set of values it can take. For example, the result of a coin toss can be represented by a random variable X that equals 1 for heads and 0 for tails. If the coin is fair, this distribution assigns probability 1/2 to X = 1 and probability 1/2 to X = 0.
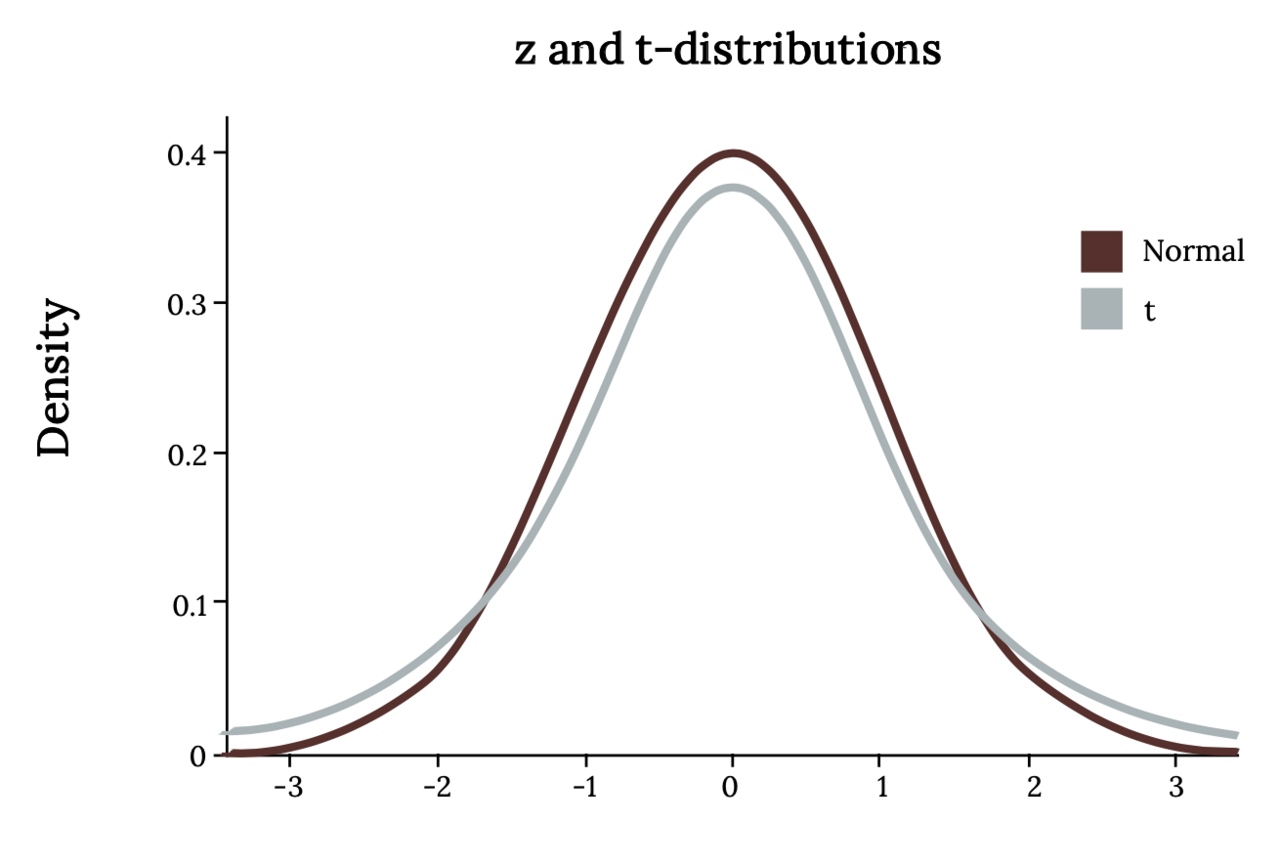
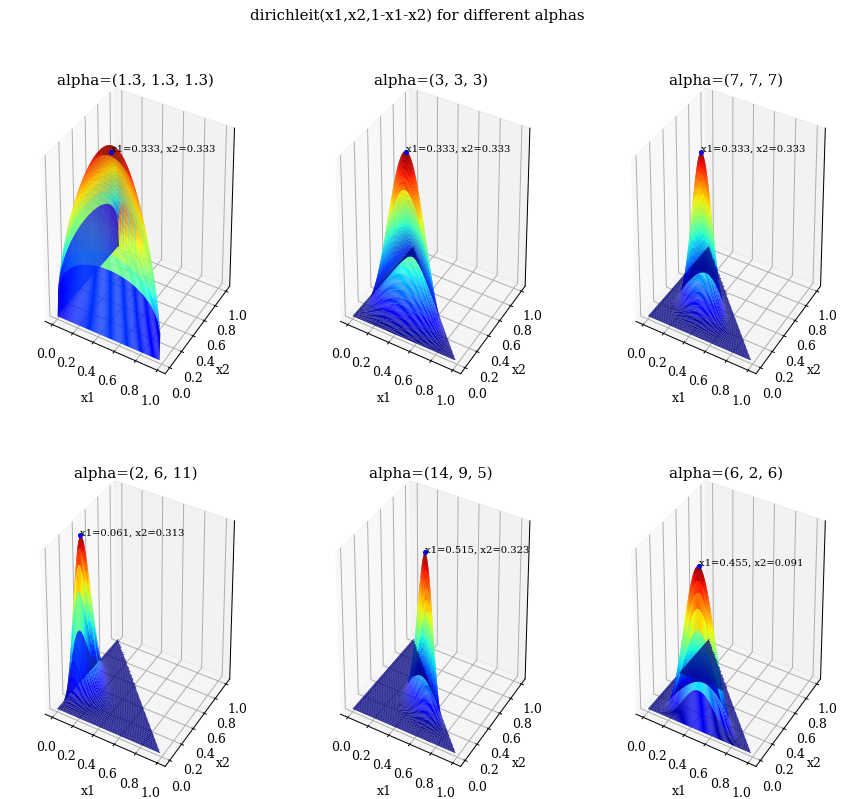
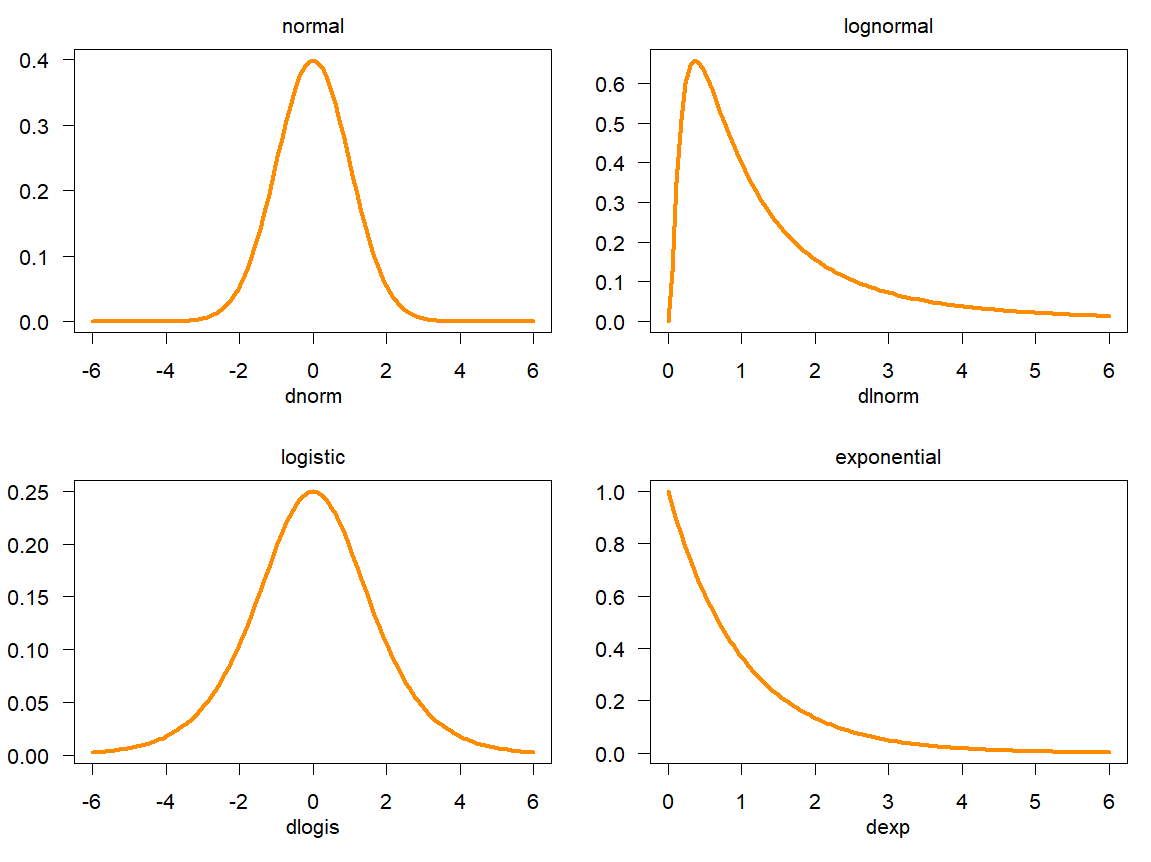
In practice, probability distributions are often described by functions such as cumulative distribution functions, probability mass functions, or probability density functions. Which description is used depends on the nature of the distribution: probability mass functions are used for discrete distributions, while probability density functions are used for many continuous distributions. Probability distributions that occur frequently or have special theoretical importance are often given specific names.
The Mathematical Core
The Poisson distribution is a discrete probability model that quantifies how likely it is to observe exactly k occurrences within a fixed interval, given that events arrive at a known, constant average rate and each event is independent of when the previous one happened. Its probability mass function takes the elegant form of λ to the power k, multiplied by e to the negative λ, all divided by k factorial, where k ranges over zero, one, two, and so on.
The single parameter λ, which must be a positive real number, simultaneously determines both the mean and the variance of the distribution—a notable property that simplifies modeling considerably. When a problem provides an average event rate r rather than a total expected count, the formula adapts naturally by substituting λ with the product of r and the interval length t. This flexibility makes the distribution a workhorse for any scenario involving a large pool of potential events, each individually rare, where one wishes to count how many actually materialize during a specified window.
Reader's Guide
Probability distributions are fundamental to probability theory and statistics, providing the formal framework for quantifying uncertainty in random phenomena. They allow the assignment of probabilities to events—subsets of the sample space—and are essential for modeling everything from coin flips to continuous measurements like weight.
The distinction between discrete and continuous distributions is key: discrete distributions use probability mass functions to assign probabilities to individual outcomes, while continuous distributions use probability density functions, where any single outcome has probability zero but intervals can have positive probability. The cumulative distribution function describes the probability that a random variable is no larger than a given value. By linking random variables to probability measures via pushforward measures, probability distributions enable rigorous statistical inference and are the basis for many named distributions used across science and engineering.
Frequently Asked Questions
Who is Probability distribution?
A probability distribution is the mathematical rulebook that specifies how likely each possible outcome of a random process is to occur. It assigns a number between zero and one to every measurable event in a sample space while strictly obeying the axioms of probability.
How does Probability distribution relate to Random Variables?
A random variable is the mapping that turns experimental outcomes into numerical values, while the distribution is the probability rule that governs how those values are spread. Put simply, the random variable supplies the 'what' and the distribution supplies the 'how likely.'
More in Probability & Statistics
Sources
Compiled from Wikipedia and the sources listed below. Text from Wikipedia is available under CC BY-SA 4.0; this entry is adapted from it.
- Wikipedia: Probability distribution (CC BY-SA 4.0).
- Word definitions: the Codexery glossary, each quoted from its Wikipedia article.
Spotted an error? Know more?
Reader corrections go straight into our review queue. Suggest an edit · How this site is sourced