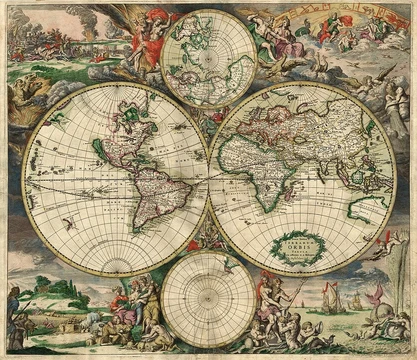
Topographic map
Large-scale maps showing relief via contour lines and both natural and artificial features.

A topographic map is a type of map characterized by large-scale detail and quantitative representation of relief features, usually using contour lines that connect points of equal elevation, though historical methods varied. Traditional definitions require such maps to show both natural and artificial features. They are typically based on systematic observation and published as a map series comprising two or more sheets that together form the whole map. A series follows a common specification for cartographic symbols, a standard geodetic framework defining the map projection, coordinate system, ellipsoid, and geodetic datum, and often adopts a national grid referencing system. Topographic maps are distinguished from smaller-scale chorographic maps covering large regions, planimetric maps lacking elevation data, and thematic maps focused on specific topics. The discipline of topography is broader, encompassing all natural and human-made terrain features. The first multi-sheet topographic series of an entire country, the Carte géométrique de la France, was completed in 1789. The Great Trigonometric Survey of India, begun in 1802, accurately determined Himalayan peak heights from distant viewpoints. Military needs drove early topographic surveys, as elevation information was vital for battle planning and defensive emplacements. National map series later became resources for infrastructure planning and resource exploitation. The International Map of the World initiative, starting in 1913, aimed to map all significant land areas at a 1:1 million scale but eventually foundered, though its indexing system remains. By the 1980s, centralized printing began giving way to digital databases of coordinates, such as the U.S. TIGER system for political boundaries and roadways, and digital elevation models from maps, aerial photographs, and satellite data. These public-domain datasets facilitated geographic information systems and enhanced the Global Positioning System. Topographic maps are used in geographic planning, Earth sciences, mining, civil engineering, and recreation like hiking and orienteering. Reading them requires practice to interpret contour lines and infer landforms such as cliffs and ridges.
- digital dataset examples
- TIGER and Digital Elevation Models (DEMs), developed in the 1980s
- common alternative names
- contour maps, topo maps, quads or quadrangles (in the U.S.)
Lore & Background
Topographic maps are distinguished by their large-scale detail and quantitative representation of relief, traditionally using contour lines that connect points of equal elevation, though historical methods varied. They are required to show both natural and artificial features. These maps are typically published as a series of two or more sheets that combine to form a whole, following a common specification for cartographic symbols and a standard geodetic framework defining the map projection, coordinate system, ellipsoid, and datum. Official topographic maps also incorporate a national grid referencing system. They are contrasted with smaller-scale chorographic maps covering large regions, planimetric maps lacking elevation data, and thematic maps focused on specific topics. The first multi-sheet topographic map series of an entire country was the *Carte géométrique de la France*, completed in 1789. The Great Trigonometric Survey of India, begun in 1802, was notable for accurately determining Himalayan peak heights from over one hundred miles away. Topographic surveys were originally military tools for battle planning and defensive emplacements, leading to the United Kingdom's Ordnance Survey. By the 1980s, centralized printing gave way to databases of coordinates usable on computers, such as the U.S. TIGER initiative for political borders and roadways, and digital elevation models compiled from topographic maps, aerial photographs, and satellite data. These public-domain datasets facilitated geographic information systems and the Global Positioning System. Uses include geographic planning, Earth sciences, mining, civil engineering, and recreation like hiking and orienteering.
Reader's Guide
Topographic maps evolved into a national resource for planning infrastructure and resource exploitation. By the 1980s, centralized printing of standardized topographic maps began to be superseded by digital databases such as TIGER and DEMs, which facilitated geographic information systems and made the Global Positioning System more useful. These datasets were in the public domain. By the mid-1990s, user-friendly resources like online mapping and GPS integration with mobile phones appeared. Topographic maps are used in geographic planning, Earth sciences, mining, civil engineering, and recreational activities such as hiking and orienteering.
Did You Know?
- The Great Trigonometric Survey of India accurately determined heights of Himalayan peaks from viewpoints over one hundred miles distant.
Frequently Asked Questions
What is a Topographic map in cartography foundations?
A topographic map is a large-scale map that quantitatively depicts both natural and artificial terrain features, most recognizably through contour lines that represent elevation changes. It is typically produced from systematic field observations and published as part of a coordinated map series rather than as a single standalone sheet.
How does a Topographic map differ from planimetric, chorographic, or thematic maps?
A topographic map is specifically distinguished because it must show relief (elevation) alongside both natural and built features, whereas planimetric maps omit elevation entirely. Chorographic maps operate at smaller scales with less detail, and thematic maps concentrate on a single subject rather than providing a comprehensive terrain picture.
What are the common alternative names fans use for a Topographic map?
In everyday cartography fandom, topographic maps are frequently called contour maps, topo maps, or—especially in U.S. usage—quads and quadrangles, referring to the standard quadrangle sheet format. These nicknames all point to the same large-scale, relief-bearing map product.
How did Topographic maps transition into the digital era?
Starting in the 1980s, traditional paper topographic sheets gave way to digital datasets such as TIGER and Digital Elevation Models (DEMs), which encode the same contour and relief information in machine-readable form. This shift allowed the quantitative elevation data that defines topographic mapping to be layered into GIS workflows and interactive applications.
More in Map Projections & Cartography Foundations 1-24
Spotted an error? Know more?
This is a living reference — every entry is fact-audited, and reader corrections feed straight into our audit queue. Suggest an edit · See this site's audit record