
Absorption spectroscopy
Technique measuring radiation absorption to identify and quantify substances.

MarsInSVG · CC BY 4.0
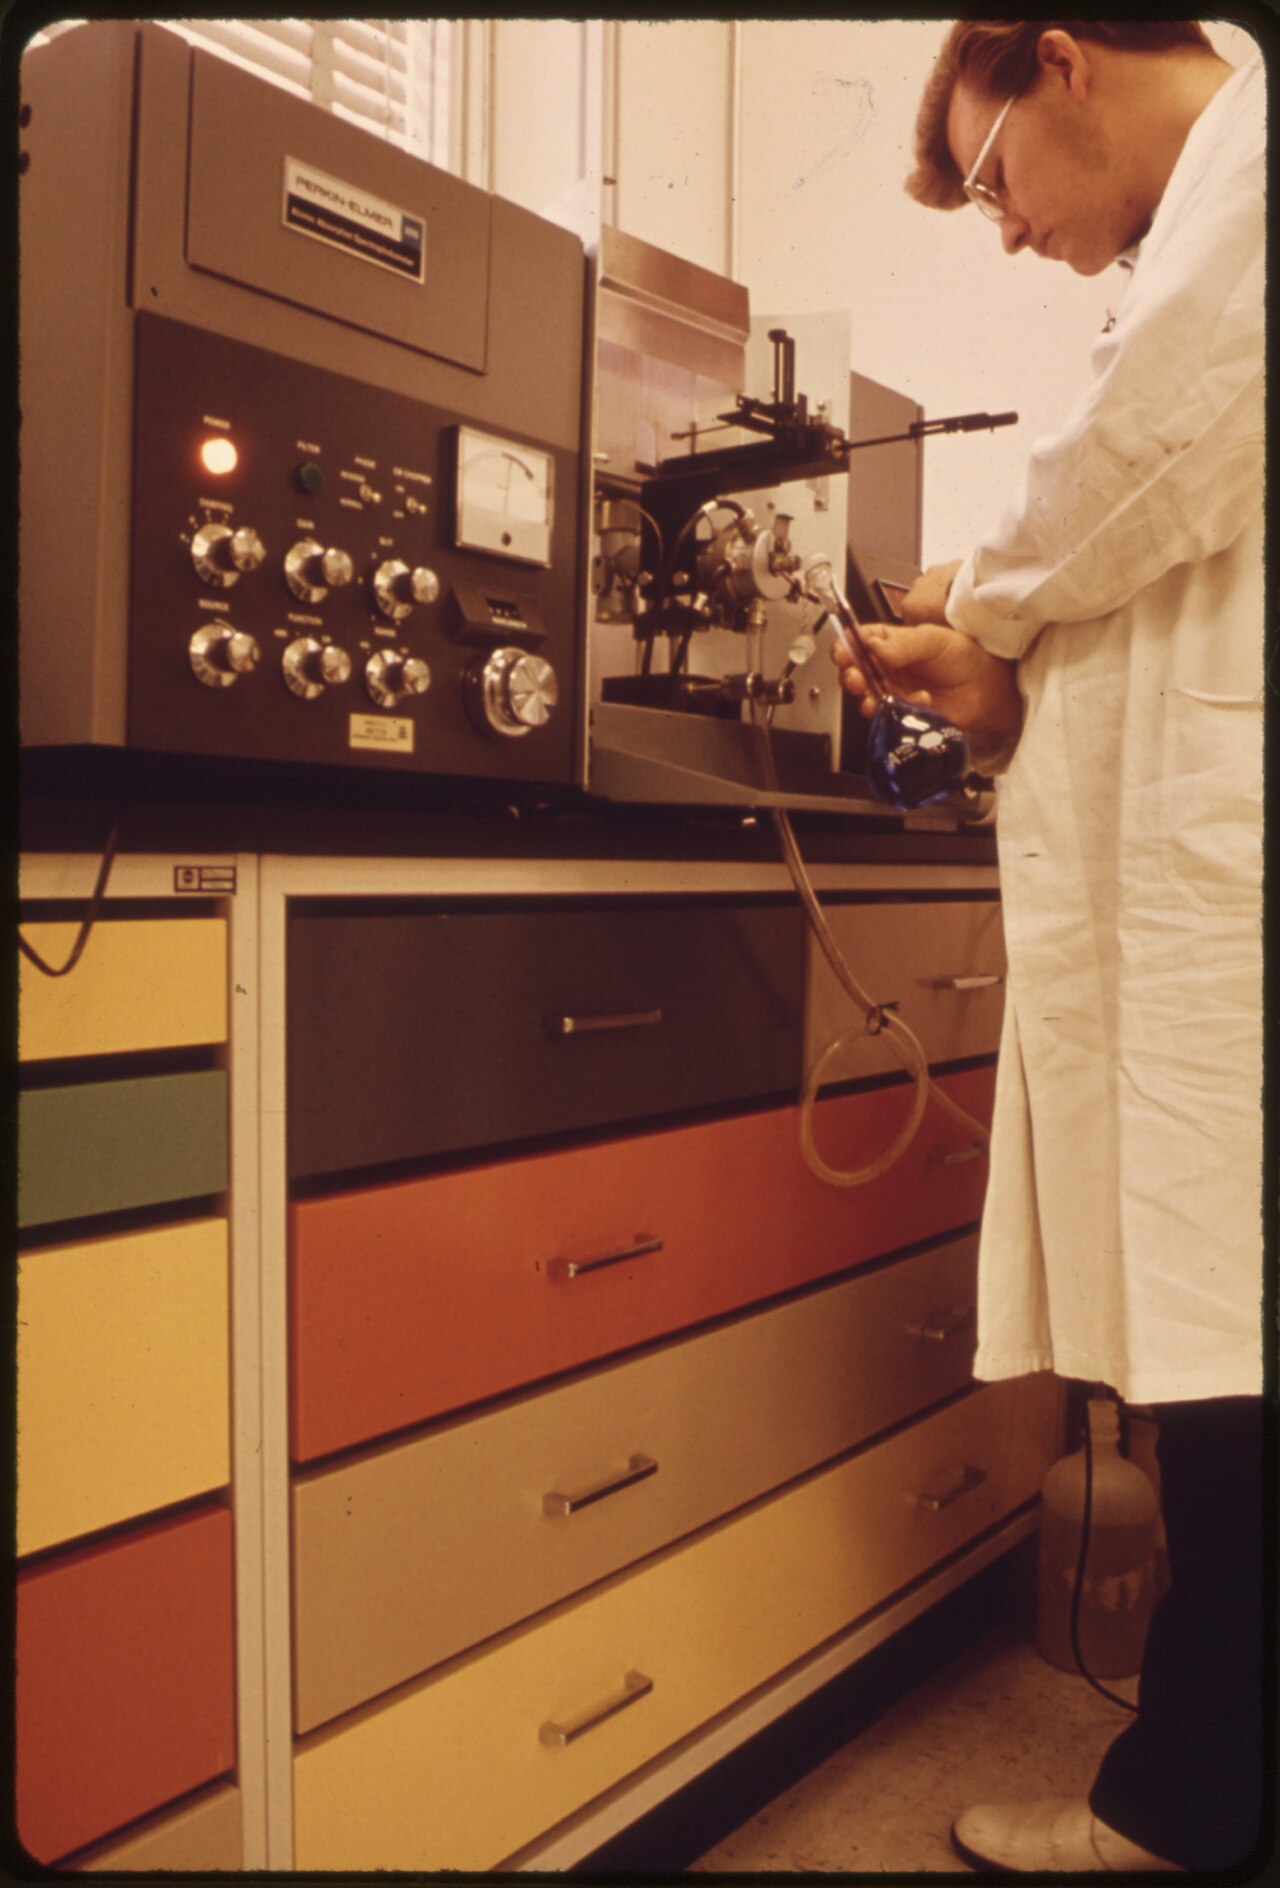
Absorption spectroscopy involves techniques that measure how a sample absorbs electromagnetic radiation as a function of frequency or wavelength. When radiation interacts with a sample, the sample absorbs energy in the form of photons, and the intensity of this absorption varies with frequency, producing an absorption spectrum. This method is applied across the entire electromagnetic spectrum. In a common experimental arrangement, a generated beam of radiation is directed at a sample, and the intensity of the radiation that passes through is detected; the transmitted energy allows calculation of the absorption. The source, sample arrangement, and detection technique vary significantly depending on the frequency range and experimental purpose.
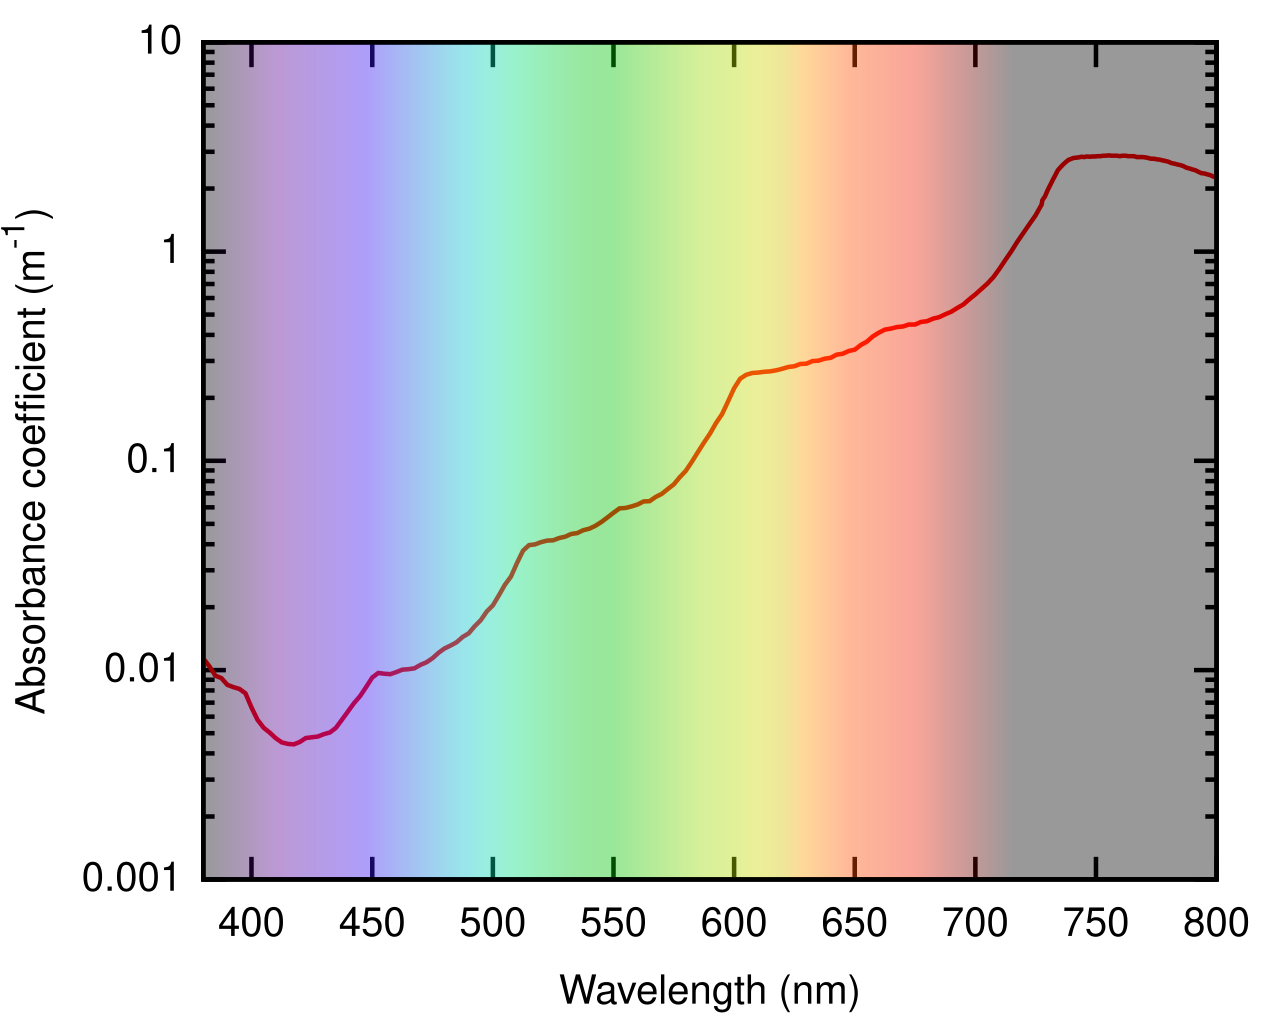
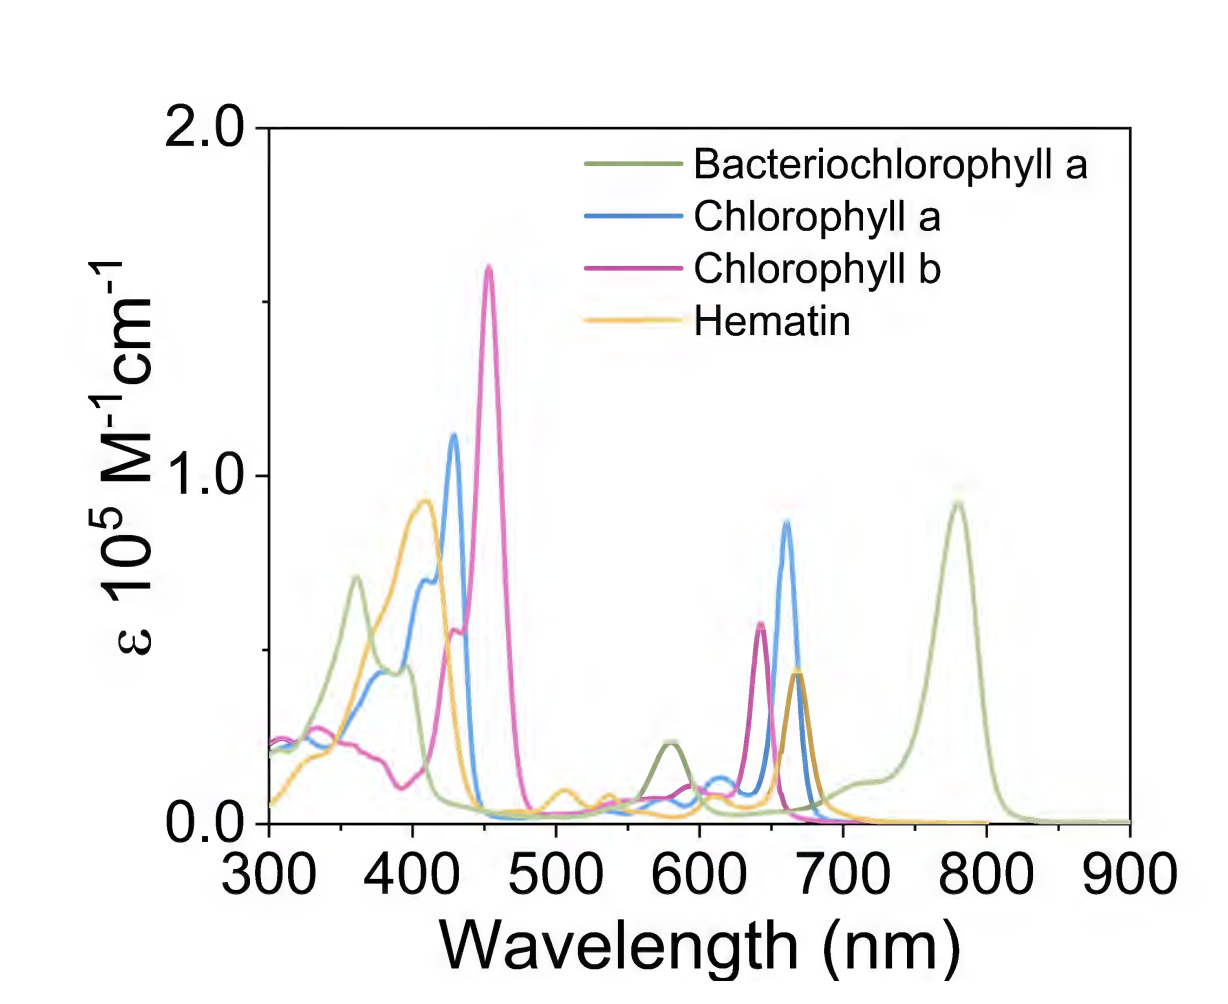
A material's absorption spectrum is the fraction of incident radiation absorbed over a range of frequencies, primarily determined by its atomic and molecular composition. Absorption is more likely at frequencies matching the energy difference between two quantum mechanical states of the molecules, with each such transition producing an absorption line. The frequencies and relative intensities of these lines depend on the sample's electronic and molecular structure, as well as interactions between molecules, crystal structure in solids, and environmental factors like temperature, pressure, and electric or magnetic fields. The lines also have a width and shape determined by the spectral density or density of states of the system. Absorption lines are classified by the quantum mechanical change induced: rotational lines (microwave region), vibrational lines (infrared), electronic lines (visible and ultraviolet), and X-ray absorptions from inner shell electron excitation. The integrated intensity under an absorption line is proportional to the amount of absorbing substance present and is also related to temperature and the quantum mechanical interaction between radiation and absorber, quantified by the transition moment.
- field
- Analytical chemistry, molecular and atomic physics, astronomical spectroscopy, remote sensing
- known_for
- Measuring absorption spectra to identify and quantify substances
- types
- Infrared, ultraviolet–visible, microwave, X-ray absorption spectroscopy
Lore & Background
Absorption spectroscopy measures how a sample attenuates electromagnetic radiation as a function of frequency or wavelength. The sample absorbs photons from the incident beam, and the intensity of this absorption varies across the spectrum, yielding an absorption spectrum. This spectrum is fundamentally determined by the material’s atomic and molecular composition; absorption lines arise at frequencies that correspond to the energy gaps between two quantum mechanical states of the molecules or atoms. The relative intensities and positions of these lines depend on electronic and molecular structure, as well as on interactions between molecules, crystal structure in solids, and environmental factors such as temperature, pressure, and electric or magnetic fields. Lines also exhibit a width and shape, often described by Gaussian or Lorentzian distributions, influenced by the spectrometer’s resolution and the physical environment of the absorber. The integrated intensity under an absorption line is proportional to the amount of absorbing substance present and is related to temperature and the quantum mechanical transition moment between the lower and upper states. Absorption spectroscopy is employed across the electromagnetic spectrum, with common analytical applications in infrared and ultraviolet–visible regions, as well as in molecular and atomic physics, astronomical spectroscopy, and remote sensing. Notable experimental arrangements involve directing a generated beam at a sample and detecting transmitted radiation, with the source, sample arrangement, and detection technique varying by frequency range and purpose.
Reader's Guide
Absorption spectroscopy is significant for its specificity and quantitative nature in chemical analysis. It allows compounds to be distinguished in a mixture, enabling applications such as detecting pollutants in air using infrared gas analyzers. Unknown samples can be identified by comparing measured spectra with reference libraries. The technique also enables remote sensing, allowing measurements in toxic or hazardous environments without contact. The absorption spectrum is related to transmission, emission, scattering, and reflection spectra through mathematical transformations, though each provides different information. The Beer–Lambert law quantitatively relates absorption to material concentration, requiring knowledge of the compound's absorption coefficient. Absorption lines are classified by quantum mechanical changes—rotational (microwave), vibrational (infrared), electronic (visible/ultraviolet), and X-ray (inner shell excitation)—and their width and shape depend on the instrument, material, and environment.
Did You Know?
- Absorption spectroscopy is performed across the entire electromagnetic spectrum.
- The absorption spectrum is primarily determined by the atomic and molecular composition of the material.
- Rotational lines occur when the rotational state of a molecule is changed and are typically found in the microwave spectral region.
- The integrated intensity under an absorption line is proportional to the amount of the absorbing substance present.
The Quantum Foundation of Absorption
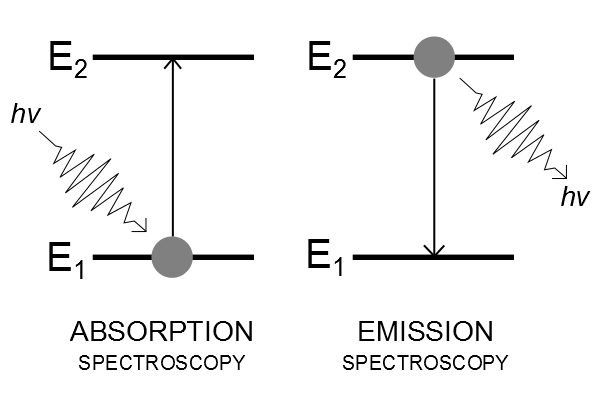
Absorption spectroscopy rests on a deceptively simple premise: when electromagnetic radiation encounters a material, photons are absorbed and their energy is taken up by the sample. The intensity of this absorption is not uniform—it fluctuates as a function of frequency, and that fluctuation constitutes the absorption spectrum. At its core, this phenomenon is governed by quantum mechanics. Radiation is preferentially absorbed at frequencies that correspond to the energy gap between two quantum states of the molecules or atoms in the sample. Each such transition produces what is called an absorption line, and a full spectrum is typically a mosaic of many such lines. The positions and relative strengths of these lines are dictated primarily by the electronic and molecular architecture of the material. However, they are not fixed in isolation. Interactions between neighboring molecules, the crystal structure in solids, and external conditions such as temperature, pressure, electric fields, and magnetic fields all contribute to shifting or modifying the observed line positions.
Taxonomy of Absorption Transitions
Absorption lines are conventionally categorized according to the specific quantum mechanical change they represent within the atom or molecule. Rotational transitions, in which the molecule's rotational state changes, typically manifest in the microwave region of the spectrum. Vibrational transitions, involving changes in the molecule's vibrational state, are most commonly observed in the infrared. Electronic transitions, where an atom or molecule shifts between electronic states, appear in the visible and ultraviolet range. At the high-energy end, X-ray absorption corresponds to the excitation of inner-shell electrons. These categories are not mutually exclusive; combined transitions such as rotation-vibration events produce new absorption lines at the summed energy of both changes. While the energy of the quantum change is the primary determinant of a line's frequency, several interactions can shift it. Electric and magnetic fields introduce shifts, and intermolecular interactions play a significant role. A molecule in the gas phase, for example, can exhibit markedly different absorption frequencies when it is dissolved in a liquid or embedded in a solid, where stronger interactions with neighboring molecules alter the energy landscape.
From Laboratory Bench to the Cosmos
Although absorption spectroscopy is often first encountered as a workhorse of analytical chemistry—where it identifies the presence of a particular substance and, in many cases, quantifies how much is present—its reach extends far beyond the laboratory. Infrared and ultraviolet-visible spectroscopy are especially prevalent in these analytical settings, but the technique also underpins research in molecular and atomic physics, astronomical spectroscopy, and remote sensing. The experimental implementation varies enormously depending on the frequency range of interest and the purpose of the measurement. The most common setup involves directing a generated beam of radiation through a sample and measuring the intensity of the radiation that emerges on the other side; the difference between incident and transmitted energy yields the absorption. Yet the choice of radiation source, sample configuration, and detection method shifts significantly across the electromagnetic spectrum, reflecting the diverse physical phenomena being probed. This flexibility is what allows the same fundamental principle—measuring how matter takes up photons—to serve fields as varied as pharmaceutical quality control and the study of distant stellar atmospheres.
Line Shape, Intensity, and Spectral Relationships
The width and shape of an absorption line carry as much information as its position. In practice, lines commonly follow a Gaussian or Lorentzian distribution, and it is frequent for a line to be characterized simply by its peak intensity and width rather than its full profile. The observed width may be limited by the spectrometer's inherent resolution, but when it exceeds that limit, it is governed by the absorber's environment. Liquids and solids, where molecules interact strongly with neighbors, tend to produce broader lines than gases. Raising the temperature or pressure of the absorbing material also broadens lines, and closely spaced neighboring transitions can overlap to create an even wider composite feature. The integrated intensity—the area under the absorption line—is proportional to the quantity of absorbing substance present and is also linked to temperature and the quantum mechanical interaction between radiation and absorber, quantified by the transition moment. Absorption and transmission spectra encode equivalent information and can be mathematically converted into one another. Emission spectra, while sharing the same frequencies as absorption, display different intensity patterns; the absorption spectrum can nonetheless be derived from emission data using Einstein coefficients.
Gallery

Frequently Asked Questions
Who is Absorption spectroscopy?
Absorption spectroscopy is an analytical technique that tracks how much electromagnetic radiation a sample soaks up at each wavelength or frequency. It serves as a go-to identification and quantification tool across chemistry, physics, and remote sensing.
What are Absorption spectroscopy's powers?
Its core ability is reading a sample's absorption spectrum to reveal both what substance is present and how much of it there is. It operates across the full electromagnetic spectrum, from microwave to X-ray regions.
What 'seasons' (types) does Absorption spectroscopy have?
The technique appears in several flavors, including infrared, ultraviolet-visible, microwave, and X-ray absorption spectroscopy. Each variant probes different electronic or vibrational transitions depending on the energy range used.
Why is Absorption spectroscopy important to the canon?
It underpins identification and quantification work in analytical chemistry, molecular and atomic physics, astronomical spectroscopy, and remote sensing. Without it, pinpointing unknown compounds or measuring atmospheric composition would be far more difficult.
How does Absorption spectroscopy's story end?
The 'ending' is a spectrum plot—absorption intensity mapped against wavelength or frequency—that the analyst reads to extract identity and concentration data. In practice, that final readout is the deliverable the technique was designed to produce.
More in Chemistry Fundamentals 1-24
Spotted an error? Know more?
This is a living reference — every entry is fact-audited, and reader corrections feed straight into our audit queue. Suggest an edit · See this site's audit record