Molecular graphics
Discipline of studying molecules through graphical representation.

Molecular graphics is both a field and a way of thinking about molecules by turning them into pictures. The International Union of Pure and Applied Chemistry (IUPAC) narrows this down to images shown on a "graphical display device." Long before computers, people drew atoms and molecules by hand—think of Dalton’s atoms or Kekulé’s benzene ring—and those early sketches still shape how we visualize molecules today. Colorful molecular graphics often appear on chemistry journal covers as art.
**History**
Before computer graphics came along, Robert Corey and Linus Pauling built physical models from hardwood, using a scale of 1 inch per angstrom and clamps to hold the structure together. These models introduced the CPK color scheme—carbon black, oxygen red, nitrogen blue, and so on—still used to tell atoms apart. In 1966, W.L. Koltun improved the design, creating what we now call Corey-Pauling-Koltun (CPK) models.
The first computer-based molecular models came from Project MAC in the mid-1960s, using wireframes on a cathode ray tube. In 1965, Carroll Johnson released the Oak Ridge thermal ellipsoid plot (ORTEP), which showed molecules as ball-and-stick figures with lines for bonds and ellipsoids for thermal motion. ORTEP quickly became the standard for X-ray crystallography and remains common today. The first practical use of molecular graphics was a wireframe display of the protein myoglobin in 1966, done by Cyrus Levinthal and Robert Langridge at Project MAC. A key advance in high-performance graphics came from Nelson Max, who created "realistic" renderings of macromolecules using reflective spheres.
In the 1970s, 3D display methods improved with cathode ray tubes and continuous-tone graphics paired with electro-optic shutter glasses. Early systems used active shutter 3D, sending different views to each eye for a stereoscopic effect. Those glasses relied on lead lanthanum zirconate titanate (PLZT) ceramics as shutters and needed batteries to sync with the display. Today, passive polarized 3D glasses are more common because they’re cheaper and let the wearer perceive depth naturally.
Macromolecular crystallography pushed molecular graphics forward because building physical models couldn’t keep up. The first two protein structures solved without the Richards’ Box were built using Stan Swanson’s program FIT on a Vector General display in Edgar Meyer’s lab at Texas A&M University. First, Marge Legg in Al Cotton’s lab solved a higher-resolution structure of staph. nuclease in 1975, then Jim Hogle solved monoclinic lysozyme in 1976. It took a full year before other graphics systems replaced the Richards’ Box for 3D density modeling. Alwyn Jones’ FRODO program (and later "O") let scientists overlay electron density from X-ray crystallography with hypothetical molecular structures.
**Types**
*Ball-and-stick models*: Atoms are small spheres, and rods connect them to show chemical bonds.
*Space-filling models*: Atoms are solid spheres sized by their van der Waals radii, overlapping where bonds form, to suggest the space they occupy.
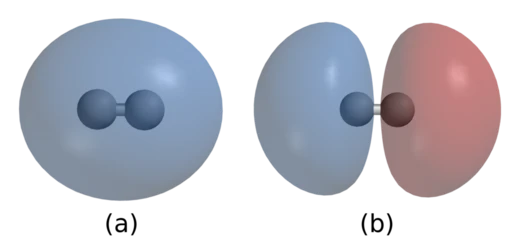
*Surfaces*: Some models show a shaded surface that represents a physical property, like electronic charge density.
*Ribbon diagrams*: These schematic drawings of protein structure are now a standard way to depict proteins. A smooth curve traces the polypeptide backbone, showing the overall path and organization in 3D. α-helices look like coiled ribbons or thick tubes, β-strands appear as arrows, and loops or coils are lines or thin tubes. The chain’s direction is shown by the arrows, and a color ramp along the ribbon can indicate the sequence from start to end. Ribbon diagrams also provide a framework for adding atomic details, like oxygen atoms bound to myoglobin’s active site.
- field
- Molecular graphics
- known_for
- Graphical representation of molecules, including ball-and-stick models, space-filling models, surfaces, and ribbon diagrams
Lore & Background
Prior to the use of computer graphics in representing molecular structure, Robert Corey and Linus Pauling developed a system for representing atoms or groups of atoms from hard wood on a scale of 1 inch = 1 angstrom connected by a clamping device to maintain the molecular configuration. These early models also established the CPK coloring scheme that is still used today to differentiate the different types of atoms in molecular models (e.g. carbon = black, oxygen = red, nitrogen = blue, etc). Koltun and are now known as Corey-Pauling-Koltun (CPK) models. The earliest efforts to produce models of molecular structure was done by Project MAC using wire-frame models displayed on a cathode ray tube in the mid 1960s. Thermal ellipsoid plots quickly became the de facto standard used in the display of X-ray crystallography data, and are still in wide use today. During the 1970s, methods for displaying 3D graphics using cathode ray tubes were developed using continuous tone computer graphics in combination with electro-optic shutter viewing devices. The first devices used an active shutter 3D system, generating different perspective views for the left and right channel to provide the illusion of three-dimensional viewing. Stereoscopic viewing glasses were designed using lead lanthanum zirconate titanate (PLZT) ceramics as electronically controlled shutter elements. Active 3D glasses require batteries and work in concert with the display to actively change the presentation by the lenses to the wearer's eyes. Many modern 3D glasses use a passive, polarized 3D system that enables the wearer to visualize 3D effects based on their own perception.
Reader's Guide
Molecular graphics has been essential for understanding molecular structure, particularly in macromolecular crystallography where traditional physical model-building could not scale. The first two protein structures solved by molecular graphics without the aid of the Richards' Box were built with Stan Swanson's program FIT on the Vector General graphics display in the laboratory of Edgar Meyer at Texas A&M University: First Marge Legg in Al Cotton's lab at A&M solved a second, higher-resolution structure of staph. Alwyn Jones' FRODO program (and later 'O') were developed to overlay the molecular electron density determined from X-ray crystallography and the hypothetical molecular structure. Among the milestones in high-performance molecular graphics was the work of Nelson Max in 'realistic' rendering of macromolecules using reflecting spheres. The discipline continues to provide visual frameworks such as ribbon diagrams, which are schematic representations of protein structure showing the overall path and organization of the protein backbone in 3D, and serve as a visual framework on which to hang details of the full atomic structure.
Did You Know?
- The CPK coloring scheme, still used today, was established by Robert Corey and Linus Pauling's early wooden models.
- Active 3D glasses for molecular graphics used PLZT ceramics as electronically controlled shutter elements.
More in Chemical Bonding And Structure 1-21
Spotted an error? Know more?
This is a living reference — every entry is fact-audited, and reader corrections feed straight into our audit queue. Suggest an edit · See this site's audit record